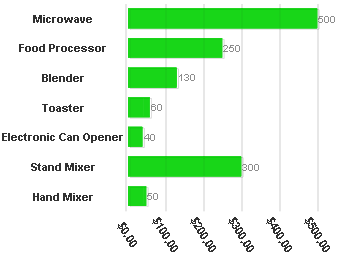
Use the Min and Max properties to frame a chart at specific axis values. If the chart has x-axis values ranging from 0 to 100, then setting Min to 0 and Max to 10 will only display the values up to 10.
To set the Max value to 500, complete the following:
This topic illustrates the following:
