To create a doughnut chart, use the InnerRadius property like the following:
Creating a Doughnut Chart in Source View:
To create a Doughnut chart in source view, click the source tab and add the following code in your source file:
<cc1:C1PieChartExtender ID="Panel1_C1PieChartExtender" runat="server"
Height="350" InnerRadius="30" TargetControlID="Panel1" Width="350">
<SeriesTransition Duration="1000" Easing="EaseOutBounce">
</SeriesTransition>
<SeriesList>
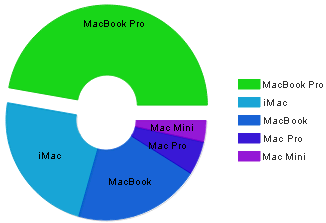
<cc1:PieChartSeries Data="46.78" Label="MacBook Pro" LegendEntry="True"
Offset="15">
</cc1:PieChartSeries>
<cc1:PieChartSeries Data="23.18" Label="iMac" LegendEntry="True">
</cc1:PieChartSeries>
<cc1:PieChartSeries Data="20.25" Label="MacBook" LegendEntry="True">
</cc1:PieChartSeries>
<cc1:PieChartSeries Data="5.41" Label="Mac Pro" LegendEntry="True">
</cc1:PieChartSeries>
<cc1:PieChartSeries Data="3.44" Label="Mac Mini" LegendEntry="True">
</cc1:PieChartSeries>
</SeriesList>
<Footer Compass="South" Visible="False">
</Footer>
<Axis>
<Y Compass="West" Visible="False">
<Labels TextAlign="Center">
</Labels>
<GridMajor Visible="True">
</GridMajor>
</Y>
</Axis>
</cc1:C1PieChartExtender>
This topic illustrates the following:
The following image shows the doughnut chart created by using the innerRadius property.