Adding a plot creates a margin on the X and Y axes

Posted by: hyeweon.kang on 30 June 2021, 10:06 pm EST

  • Posted 30 June 2021, 10:06 pm EST

    I am making a chart by adding plots because I need to draw multiple data graphs overlaid.

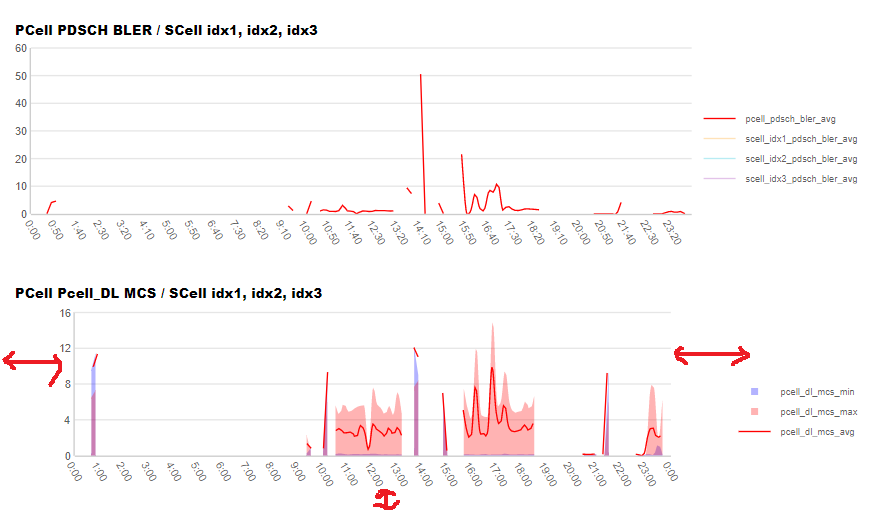
    However, even if I delete all the x-axis and y-axis information of the newly added plot, there is a huge blank space when I look at the preview. Is there any way to remove this?

  • Posted 1 July 2021, 5:58 am EST

    can you share a report that would allow us to reproduce the problem that you faced?

  • Posted 1 July 2021, 8:17 pm EST - Updated 3 October 2022, 8:11 am EST

    I don’t know how to share the report, so I’m sharing a screenshot.

    The chart above is a normal chart, and the chart below is a chart with several overlapping plots.

    Even though I removed all of the x and y axes except for Plot 1, the blank space is so large.

  • Posted 2 July 2021, 4:39 am EST

    You can archive a report into a zip file and attach it to a message by using the attachment area at the bottom.

Need extra support?

Upgrade your support plan and get personal unlimited phone support with our customer engagement team

Learn More

Forum Channels