Posted 30 June 2021, 5:02 am EST - Updated 3 October 2022, 8:12 am EST
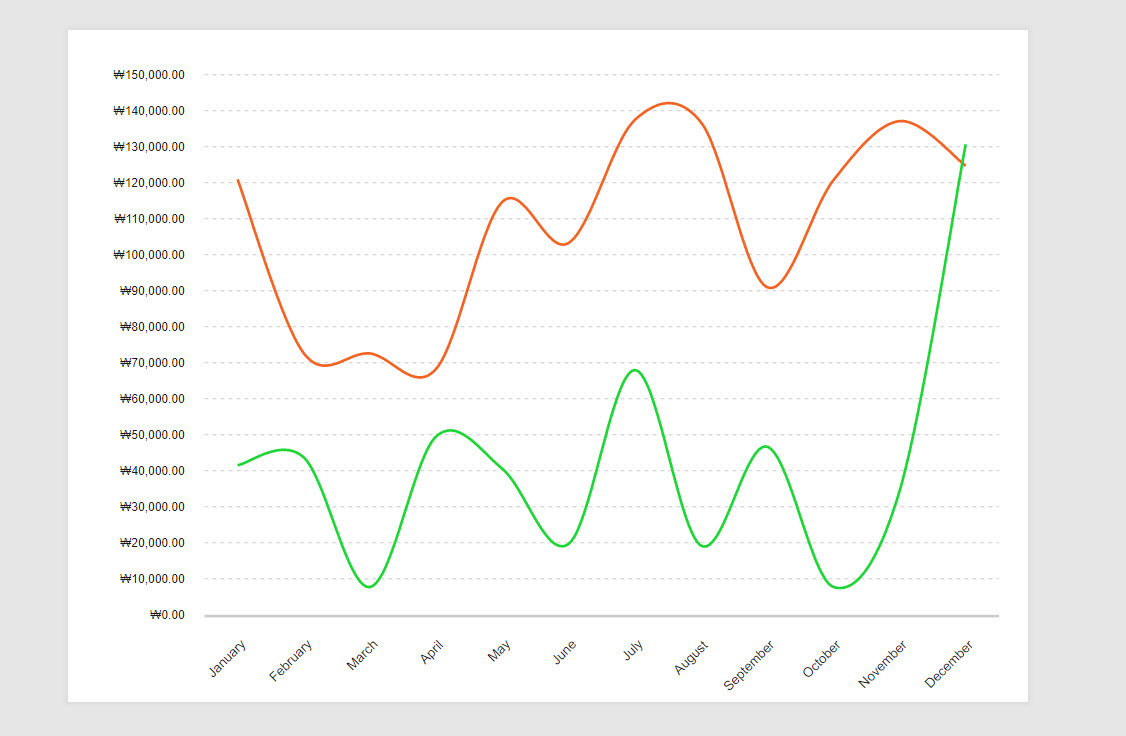
Controlling the tickness of each line in line graph
Posted by: joomin.lee on 30 June 2021, 5:02 am EST
-

joomin.lee
-

sergey.abakumov

Posted 30 June 2021, 6:25 am EST
Hello,
As of now, The only way to do that is to configure 2 Line plots on the same chart and use different Line Width settings for them.
https://www.grapecity.com/activereportsjs/docs/ReportAuthorGuide/Report-Items/Data-Regions/Chart/line-chart#line-and-symbols-look-and-feel
However, the upcoming version will include new chart features that would allow achieving the effect that you described. -
joomin.lee
Posted 30 June 2021, 8:17 pm EST
Thanks for the reply.
I’m looking forward to the new version…!
When does the upcoming version be released? -
sergey.abakumov
Posted 1 July 2021, 5:08 am EST
The current release date of v2.2 is September 6, 2021