Express the area with conncecting up and down values

Posted by: joomin.lee on 27 June 2021, 8:07 pm EST

  • Posted 27 June 2021, 8:07 pm EST

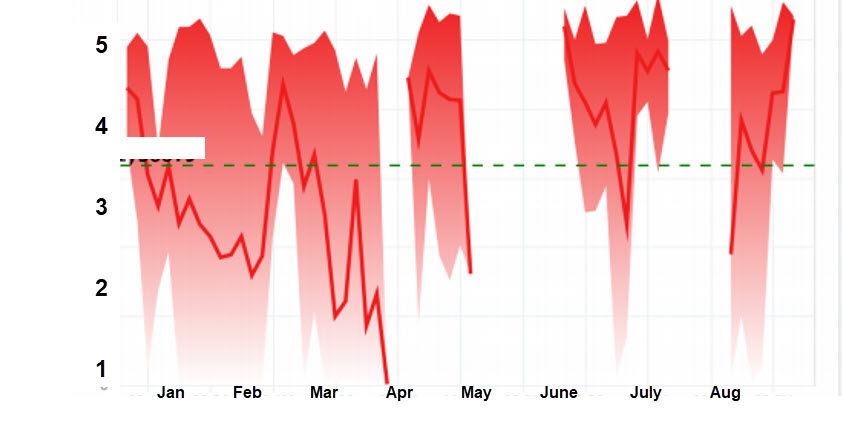
    I want to mark the maximum value and minimum value incording to the time axis(x-axis) on the graph, and then express those values as a region.

    → I want to connect the value point up and down to make an area.

    Attachment image is the example chart what I’d like to make.

    Is it possible? Then please let me know the way or process to excute.

    Best regards.

    Joomin Lee

  • Posted 27 June 2021, 8:40 pm EST - Updated 3 October 2022, 8:12 am EST

  • Posted 28 June 2021, 10:10 am EST

    Hello,

    This functionality is not supported

Need extra support?

Upgrade your support plan and get personal unlimited phone support with our customer engagement team

Learn More

Forum Channels