Operators that can express the period between specific time

Posted by: joomin.lee on 13 July 2021, 6:22 am EST

    • Post Options:
    • Link

    Posted 13 July 2021, 6:22 am EST - Updated 3 October 2022, 8:10 am EST

    Always appreciate for fast reply.

    I want to ask about the function especially for the operator which can express the period between specific time.

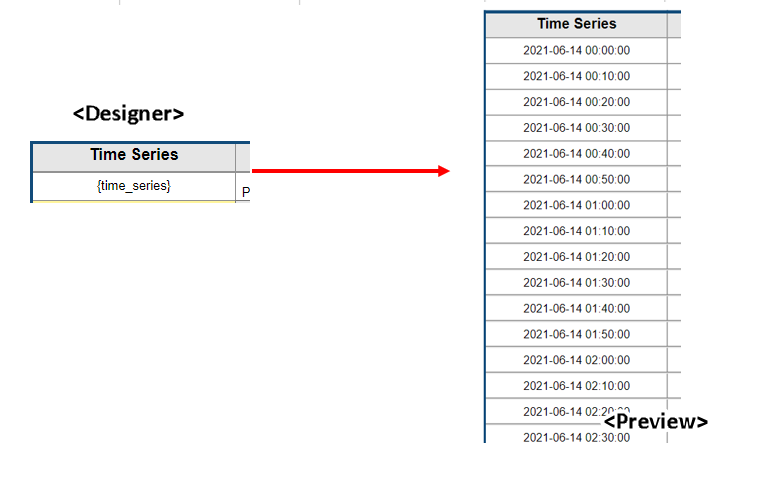
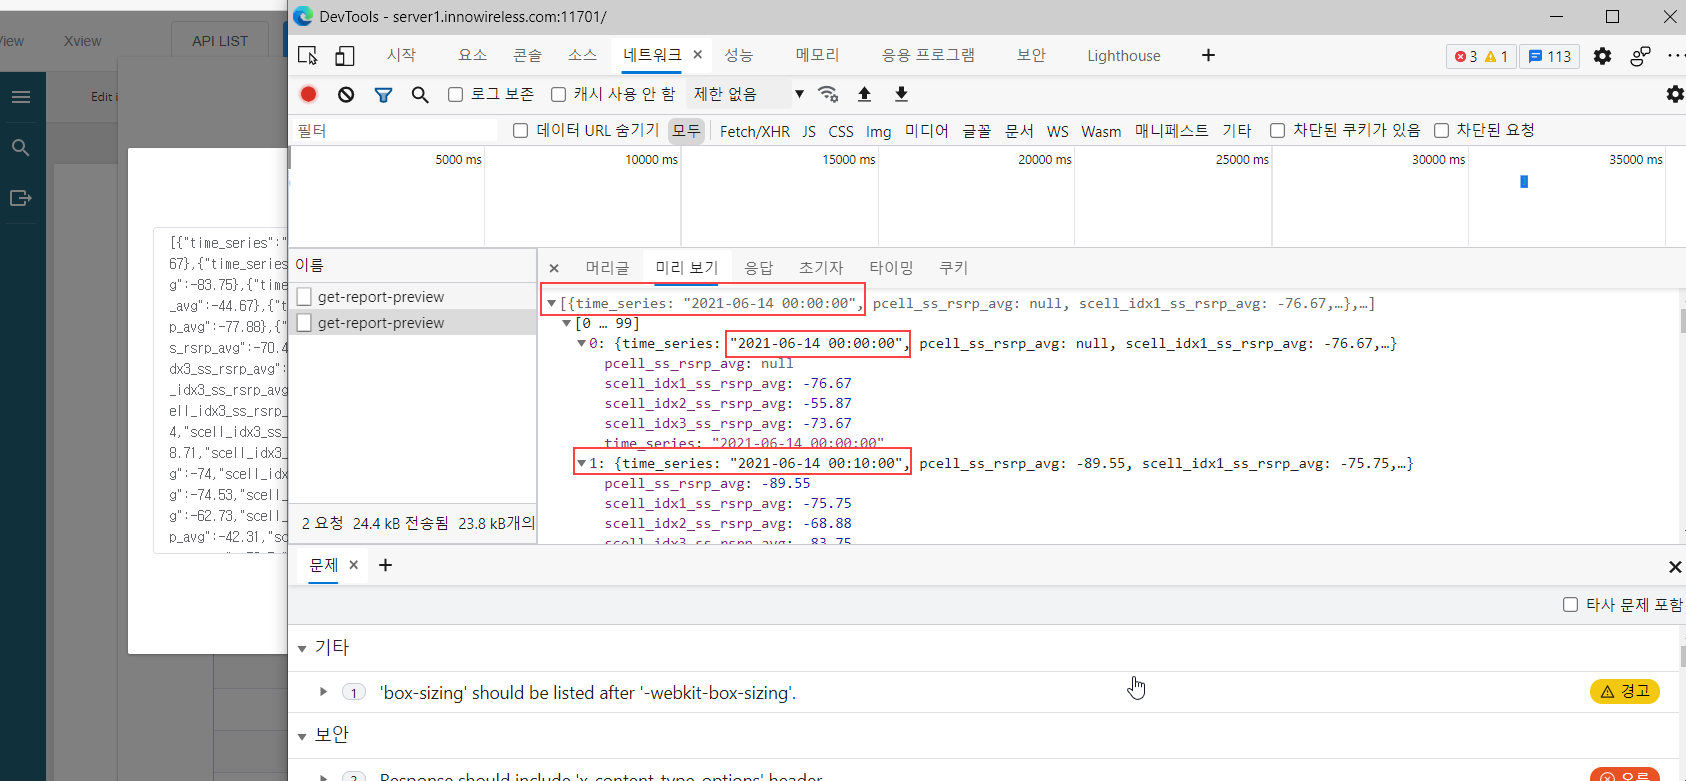
    For example, I have a dataset called ‘timesires’.

    The data for that dataset is consisted of 2021-06-14 00:00~ 2021-06-15 00:00.

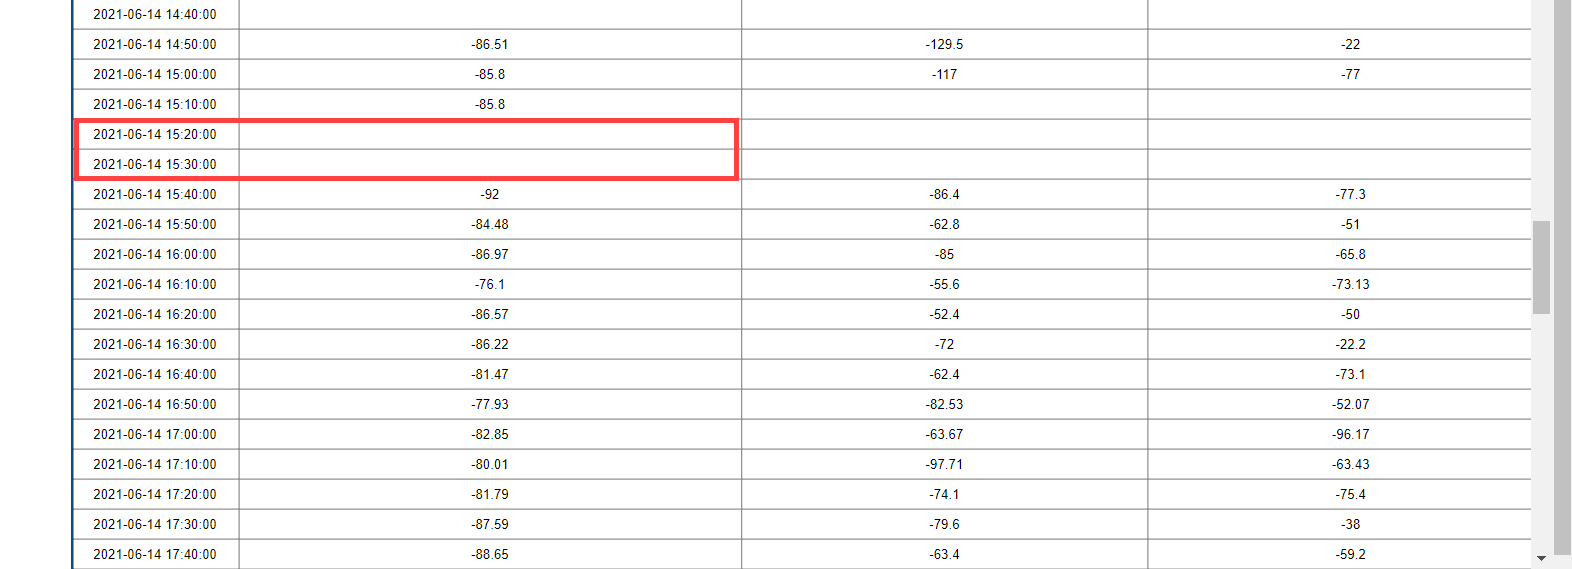
    (I need the operator that can express the gap time between null cells.)

    Red box in below photo is what I want to operate.

    I need to express the latency and then show it as statistics at the bottom if the report.

    Plus, is there any function that can express the period between the start time and end time?

    (e.g. Function that can calculate the gap time for 2021-06-14 00:00~ 2021-06-15 00:00)

    Looking forward to you reply.

  • Posted 14 July 2021, 5:49 am EST

    Hello,

    It seems to me that you need several functions to work with data across several adjacent rows. ActiveReportsJS does not provide a lot of functions to do that. The only functionality available is retrieving the value from a previous row which I mentioned in another forum post.

    I guess that the best solution for what you described would be to pre-process data on the application level and then push it into a report using the “runtime data binding” feature:

    https://www.grapecity.com/activereportsjs/docs/ReportAuthorGuide/Databinding#runtime-data-binding

  • Posted 21 July 2021, 8:35 pm EST

    Thanks for the reply.

    Then, does the Designer tool provide a function for time calculation?

    For example, when subtracting a minimum time from maximum time as shown below.

    {max(time_series) - min(time_series)}

    (time_series : Dataset that I have.)

    I want to know the way for converting time as constant value and express the gap beteween times.

    Please let me know if there is.

  • Posted 26 July 2021, 6:24 am EST

    it depends on the format of the time_series field. could you provide a small snapshot of the dataset?

  • Posted 26 July 2021, 7:22 am EST - Updated 3 October 2022, 8:10 am EST

    Ok, Below is the snapshot.

  • Posted 26 July 2021, 7:41 am EST

    By “snapshot”, I mean the data sample before it’s visualized in a report.

  • Posted 26 July 2021, 10:50 am EST - Updated 3 October 2022, 8:10 am EST

    Is it right way to show you data sample as below?

    If it’s not, please tell me more detail.

  • Posted 27 July 2021, 5:46 am EST

    First off, you can mark the “time_series” field as a Date value in the data set field definition:

    https://www.grapecity.com/activereportsjs/docs/ReportAuthorGuide/Databinding#data-set-fields

    Then, you can use the “DateDiff” function that returns the number of time intervals between two specified dates.

    https://www.grapecity.com/activereportsjs/docs/ReportAuthorGuide/Expressions/Functions/date-time#datediff

    So, the difference between min and max values of time_series could be calculated as

    {DateDiff("s", Min(time_series), Max(time_series))}
    
  • Posted 27 July 2021, 6:47 am EST

    Thanks a lot.

Need extra support?

Upgrade your support plan and get personal unlimited phone support with our customer engagement team

Learn More

Forum Channels