Posted 29 July 2021, 8:20 pm EST - Updated 3 October 2022, 8:10 am EST
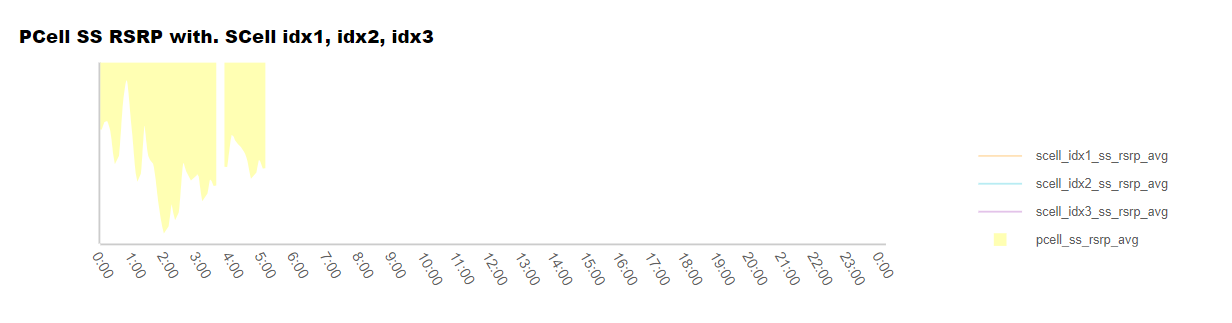
The y-axis text is not visible
Posted by: hyeweon.kang on 29 July 2021, 8:20 pm EST
-

hyeweon.kang
-

sergey.abakumov

Posted 30 July 2021, 5:07 am EST
Hello,
Could you share a report file including a data sample so that I can reproduce the problem? -
hyeweon.kang
Posted 30 July 2021, 5:34 am EST
Thank you for asking.
But actually, I do not use the Active Reports program.
I am using it by receiving a domain address and installing it on the server.
Therefore, the report cannot be shared in json format.
How to solve the problem in this case? -
sergey.abakumov
Posted 30 July 2021, 5:39 am EST
This is the ActiveReportsJS forum. We can’t help if you are using some other product.