Posted 8 October 2018, 3:34 am EST
Good Morning
I am trying to change the Line Color and Thickness of a line chart in VB.Net and AR12, but could not get it right.
Forums Home / ActiveReports / ActiveReports v7+
Posted by: douglass on 8 October 2018, 3:34 am EST

douglass
Posted 8 October 2018, 3:34 am EST
Good Morning
I am trying to change the Line Color and Thickness of a line chart in VB.Net and AR12, but could not get it right.

mohitg
![]()
Posted 8 October 2018, 4:38 am EST
Hello Sir,
Please use “Properties” property of the series of the Chart as follow:
series1.Properties = New GrapeCity.ActiveReports.Chart.CustomProperties(New GrapeCity.ActiveReports.Chart.KeyValuePair() {New GrapeCity.ActiveReports.Chart.KeyValuePair("Line", New GrapeCity.ActiveReports.Chart.Graphics.Line(System.Drawing.Color.Blue, 6)), New GrapeCity.ActiveReports.Chart.KeyValuePair("BarType", GrapeCity.ActiveReports.Chart.BarType.Bar)})
Hope it helps.
Thanks,
douglass
Posted 8 October 2018, 10:09 am EST - Updated 30 September 2022, 5:49 pm EST
Hi
Ok, it changed the color, but I cannot change the thickness of the line. does not matter if I use any value from 0 to 6. Line stays the same thickness. Why do you use a bar type in the last KeyValuePair?
Why can this not by something simple like?
Line. Color = System.Drawing.Color.Blue
Line.Thickness = 2
mohitg
![]()
Posted 9 October 2018, 5:16 am EST
Hello,
Why do you use a bar type in the last KeyValuePair?
This code sent by mistake. you can only use the “KeyValuePair” for the only Line type like as follow:
s.Properties = New GrapeCity.ActiveReports.Chart.CustomProperties(New GrapeCity.ActiveReports.Chart.KeyValuePair() {New GrapeCity.ActiveReports.Chart.KeyValuePair("Line", New GrapeCity.ActiveReports.Chart.Graphics.Line(System.Drawing.Color.Blue, 6))})
does not matter if I use any value from 0 to 6
I am not reproducible the error at my end. Please refer to the attached sample and image.
Thanks,
Line.zip[img]https://gccontent.blob.core.windows.net/forum-uploads/file-735f526f-39f3-468c-9f64-3c783a988103.png[/img]
douglass
Posted 4 March 2019, 9:28 am EST
Hi
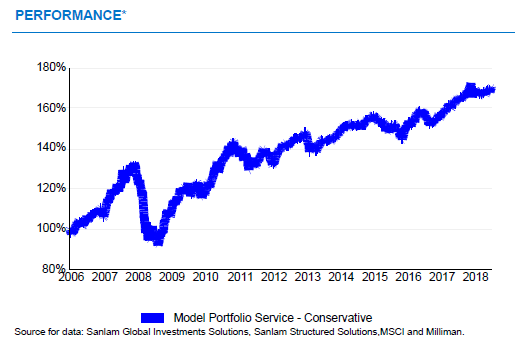
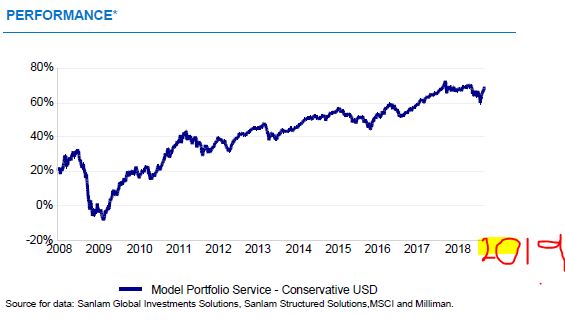
I have a line chart with daily data for a few years. My labels do not pickup the last year, 2019. Is there something I can do to force the end value?
my code for the axces is
With .ChartAreas(0).Axes(“AxisX”)
'.Max = 2020
.Title = “”
’ .StaggerLabels = True
'.LabelsGap = 50
.LabelsGap = 90
.LabelFont.Font = FontChartDetail
'.Position = 0
.LabelsAtBottom = True
.Line.Color = Color.LightGray
            End With

            'YAxis
            With .ChartAreas(0).Axes("AxisY")
                .Title = ""
                .LabelsGap = 0
                .LabelFont.Font = FontChartDetail
                .DisplayScale = True
                .LabelsVisible = True
                '.SmartLabels = True
                .LabelFormat = "{0}%"
                '.Max = 120
                '.Min = 0
                'Add Minor Tick
                '.MinorTick = oMinorTick
                'Add major tick
                .MajorTick = oMajorTick

                '    '.MajorTick.[Step] = 1
                '    '.MajorTick.GridLine = New GrapeCity.ActiveReports.Chart.Graphics.Line(Color.Gray, 1, GrapeCity.ActiveReports.Chart.Graphics.LineStyle.Solid)
                '    '.LabelFont.Angle = -45
                '    ' .TitleFont.Angle = 0
                .SmartLabels = False
                .Line.Color = Color.LightGray
            End With
douglass
Posted 4 March 2019, 9:33 am EST - Updated 30 September 2022, 5:49 pm EST
douglass
Posted 4 March 2019, 9:35 am EST
Herewith the data
douglass
Posted 4 March 2019, 9:36 am EST
data
mohitg
![]()
Posted 5 March 2019, 5:53 am EST
Hello Douglass,
It seems that the file is not attached properly. Could you please upload the file in zip format or please upload the file in following dropbox link:
https://www.dropbox.com/home/File%20requests/Support%20Inbox
Thanks.


