Dynamic charts based on related data

Posted by: hanidraidi on 14 September 2017, 7:19 pm EST

  • Posted 14 September 2017, 7:19 pm EST - Updated 30 September 2022, 6:26 pm EST

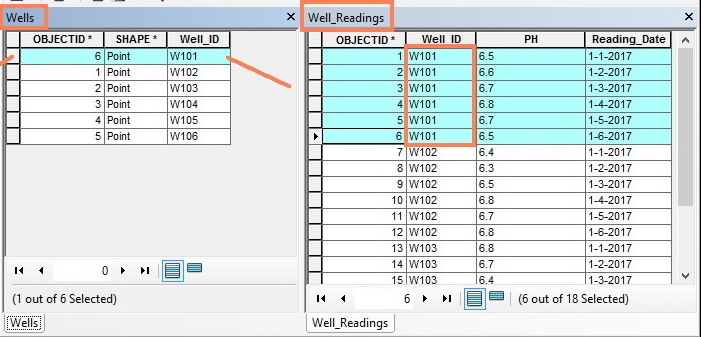
    [activereports_archive]I have two tables stored in SQL Server database: a table for wells, and the other is a table for readings of these wells, such that each well has a unique ID stored in Well_ID field in wells table, and at the readings table there are many readings for the same well and identified by the same Well_ID field. I am designing a report for the wells table and want to add a dynamic chart inside the report that is drawn based on data related to each well (from the readings table):

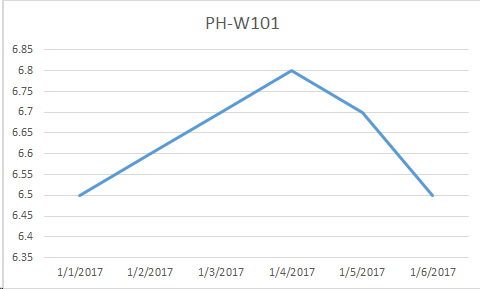
    I want to draw a dynamic chart for any well based on data in readings table which contains Well readings like PH that also contains Well_ID field.

    When building a chart, in the data source configuration, I could write an SQL query that takes data from the readings table. However, I am not able to calibrate it so it takes Well_ID from features.

    The SQL query is like this

    "Select PH_Reading from dbo.A.Well_Readings”

    This query returns the data for all wells, and I am not able to set a Where clause that queries data for only the targeted well based on Well_ID

    This is better elaborated in this example:

    I want to design a report (rpx) that will be installed on wells layer, such that when it is run on a specific well (e.g. with ID W101) it queries the data from the readings table for W101 well, and based on this data the chart is drawn as shown in the attached screenshots

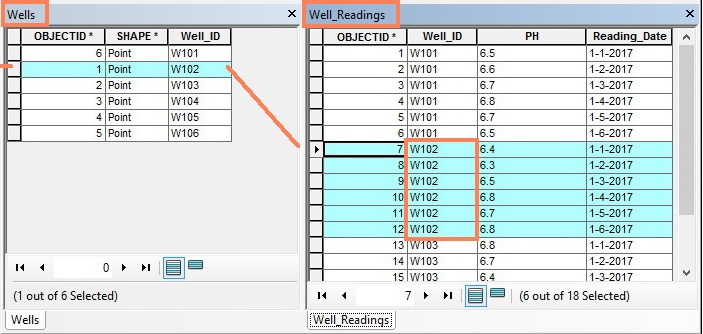
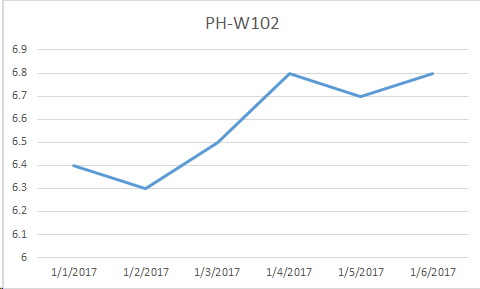
    When the report is run for W102 well, the report should query the data for W102 from the readings table and draw the PH chart based on it as in the screenshots below, and the same can be done for any well that report is run for

    My question is how to define such query in datasource section, that queries data from readings table based on the selected Well ID in the layer

    Is there a way to do this?

    Any help is highly appreciated

    Kind Regards,

    Hani[/activereports_archive]

  • Posted 14 September 2017, 7:19 pm EST

    [activereports_archive]Hi Hani,

    It is definitely possible to do what you have described. You would need to add a parameter to the report and then use it in the Chart’s datasource to filter according to the parameter’s value. For eg.

    select [Order Details].OrderID, [Order Details].UnitPrice, [Order Details].ProductID

    from Orders inner join [Order Details] on Orders.OrderID = [Order Details].OrderID Where [Orders].OrderID = < %param:Parameter1%>

    Kindly take a look at the following documentation link for the walkthrough: http://arhelp.grapecity.com/webhelp/AR11/index.html#Parameters%20for%20Charts.html

    I have also attached a sample report for your reference. Kindly change the datasource path from the Chart wizard to point to the NWind.mdb database on your machine. On running the report, enter an OrderID (for eg. 10248) to see the specific data.

    Hope it helps[/activereports_archive]

    2017/07/ParameterizedChart.rpx

  • Posted 14 September 2017, 7:19 pm EST

    [activereports_archive]Dear AbdiasM,

    Thank you for the valuable input,

    I’ve added a parameter (Parameter1) , and added a where clause to the SQL Query, so it became like this:

    SELECT [Well_ID], [ReadDate],[ReadValue]

    FROM [W].[dbo].[Well_Readings_View]

    WHERE [Well_ID]=< %param:Parameter1%>

    However, the chart is blank, and nothing is plotted as in the attached screenshot

    What might be the problem here?

    Regarding the report you attached in your previous post, when I try to run it, I get the following error:

    Error Message: Report Script Compile Error on Line 9 Error= '‘DatDynamics.ActiveReports.ReportScript’ does not contain a definition for ‘TextBox1’ and no extension metthod ‘TextBox1’

    Kind Regards,

    Hani[/activereports_archive]

  • Posted 14 September 2017, 7:19 pm EST

    [activereports_archive]What version of ActiveReports are you using? It looks like an old version. Please try using the latest version i.e AR11 which you can download from http://activereports.grapecity.com/downloads/

    Also, in your sql query I notice a space after < (beginning of the parameter). Please correct that and try running the report with the latest version.

    [/activereports_archive]

  • Posted 14 September 2017, 7:19 pm EST

    [activereports_archive]Dear AbdiasM,

    My ActiveReports package is installed with Geocortex Essentials (GE) as an out-of-the-box item with GE, that I use as web mapping platform.

    I use ActiveReports to build reports for GE, which uses ActiveReports 5.3, and no higher version of ActiveReports can be used by GE.

    I believe that I can deal with 5.3 only. In this case, can I build a parameterized chart?

    Kind Regards,[/activereports_archive]

  • Posted 14 September 2017, 7:19 pm EST

    [activereports_archive]The version you’ve mentioned pertains to AR3 (which is an unsupported version now) and you can build parameterized chart with version as well. Please take a look at the following documentation link for details on this:

    http://arhelp.grapecity.com/webhelp/Legacy/ARNET3/

    Navigate to - User Guide > Samples and Walkthroughs > Walkthroughs > Standard Edition Walkthroughs > Advanced > Parameters Walkthroughs > Parameters with Charts

    Hope it helps[/activereports_archive]

  • Posted 14 September 2017, 7:19 pm EST

    [activereports_archive]Many Thanks AbdiasM,

    I followed the walk-through, and it worked well

    Once again, thank you very much for the valuable input[/activereports_archive]

  • Posted 14 September 2017, 7:19 pm EST

    [activereports_archive]I’m glad to know you that it worked for you :slight_smile:

    I would strongly recommend you to upgrade to the latest version for continued support and for all the features and enhancements that have been added since AR3. [/activereports_archive]

  • Posted 22 April 2018, 8:33 pm EST

    Hi Abdiasm,

    I having same issue, i.e using same Geocortex Essentials Reporting Software. Suppose a report is able to invoke with URL like this http://<location_at_report_present>/Geocortex/Essentials/REST/sites/testsite1/map/mapservices/12/layers/3/reports/0/run in a browser with out parameters is able to get the report. But if that report is parameter based, how will we pass the parameters in the URL so that get the report based on passed in parameter value.

    Tried this below url, but doesn’t seems working.

    http://<location_at_report_present>/Geocortex/Essentials/REST/sites/testsite1/map/mapservices/12/layers/1/reports/4/run?outputFormat=Pdf&where=Parameter1%3D<param1_value>&spatialRel=Intersects&f=file

    Thanks.

    nm.

Need extra support?

Upgrade your support plan and get personal unlimited phone support with our customer engagement team

Learn More

Forum Channels