Posted 6 August 2018, 7:47 am EST - Updated 30 September 2022, 6:07 pm EST
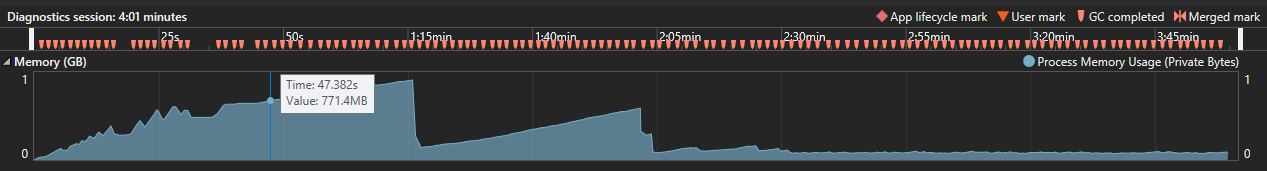
I just performance profiled an application using a file that contains 150 future reports. I noticed a high memory usage going up to 1 GB. Using 300 reports it goes up to 2 GB and then crashes.
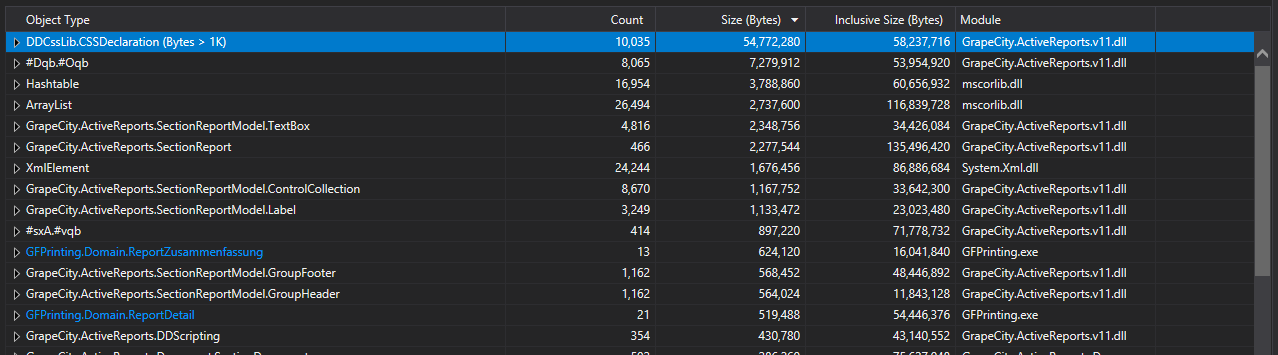
I find objects of DDCssLib.CSSDeclaration (Bytes > 1K) using more than 54’770’000 Bytes as well as others. The Memory Usage curve has a very odd behaviour. And right now I don’t know how I can manage or have to start looking for a potention memory leak. Any suggestions are very welcome.