Pie Chart Fill Patterns?

Posted by: mark on 6 December 2019, 5:40 pm EST

    • Post Options:
    • Link

    Posted 6 December 2019, 5:40 pm EST - Updated 30 September 2022, 5:24 pm EST

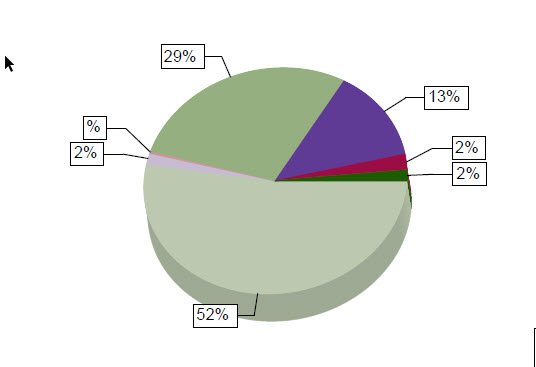
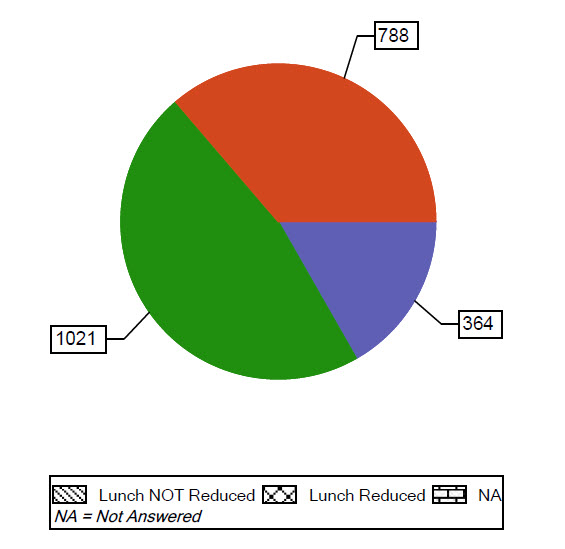
    I’m using some pie charts in ActiveReports 12, and they look great on screen and in a saved PDF, but when the clients print them in black and white (like on a laser printer) the colors are too close together. I can’t seem to find a way to add an patterns, like dots, crosshairs, etc. to the pie slices to help differentiate - is that possible? Attaching an image of what one of my charts looks like today.

  • Posted 9 December 2019, 7:42 am EST

    Hello,

    You can use a 2D chart to meet the requirement by setting its BlackAndWhiteMode property to True.

    A report has been attached for your reference. Please bind the same to NWIND.mdb.

    Regards,

    Esha

    Chart_Pie.zip

  • Posted 12 December 2019, 9:48 pm EST - Updated 30 September 2022, 5:24 pm EST

    Thanks Esha - this is super helpful. I found the settings, but for some reason when I change to 2D and set Black and White Mode to TRUE (either through the UI or through code), it only seems to change the Legend, not the actual pie slices. Do I need to clear something or pick a different Color Palette? I’ve got it set to “Default” like your example, but still the Legend is all that changes.

  • Posted 16 December 2019, 2:48 am EST

    Hello,

    We could observe the same with 3D charts and have reported the issue to the development team (Internal Tracking ID: 277789).

    Note that for 2D charts, the issue does not appear at our end, with 12.3.17127.0 version. Refer the attached gif showing the same. We have used a Doughnut chart type and set the series’ HoleSize property to 0, to obtain a pie chart in 2D from the same.

    Regards,

    Esha

    Demo1.zip

  • Posted 17 December 2019, 10:06 pm EST

    Thanks Esha - that’s very helpful. I think this may be another bug in the 12.2 version I am using. I was eventually able to get it to show within the designer when I changed to the donut chart, but now when I actually RUN the chart to generate a PDF, the entire donut is solid black while the legend still shows correctly. Perhaps I need to upgrade to that latest service pack.

    Do you have any idea whether this kind of functionality is better in the upgrade to v13, or perhaps the upcoming v14 of ActiveReports? It may be worth the hassle and expense of upgrading all my reports to a newer version if this issue works better with color charts.

  • Posted 18 December 2019, 6:36 am EST

    Hello,

    The issue is not observed by setting “ConvertMetaToPng” property to True for the PDF export.

    Please check the same.

    Thanks.

Need extra support?

Upgrade your support plan and get personal unlimited phone support with our customer engagement team

Learn More

Forum Channels