Posted 3 July 2025, 4:06 pm EST
Hello Mescius Support Team,
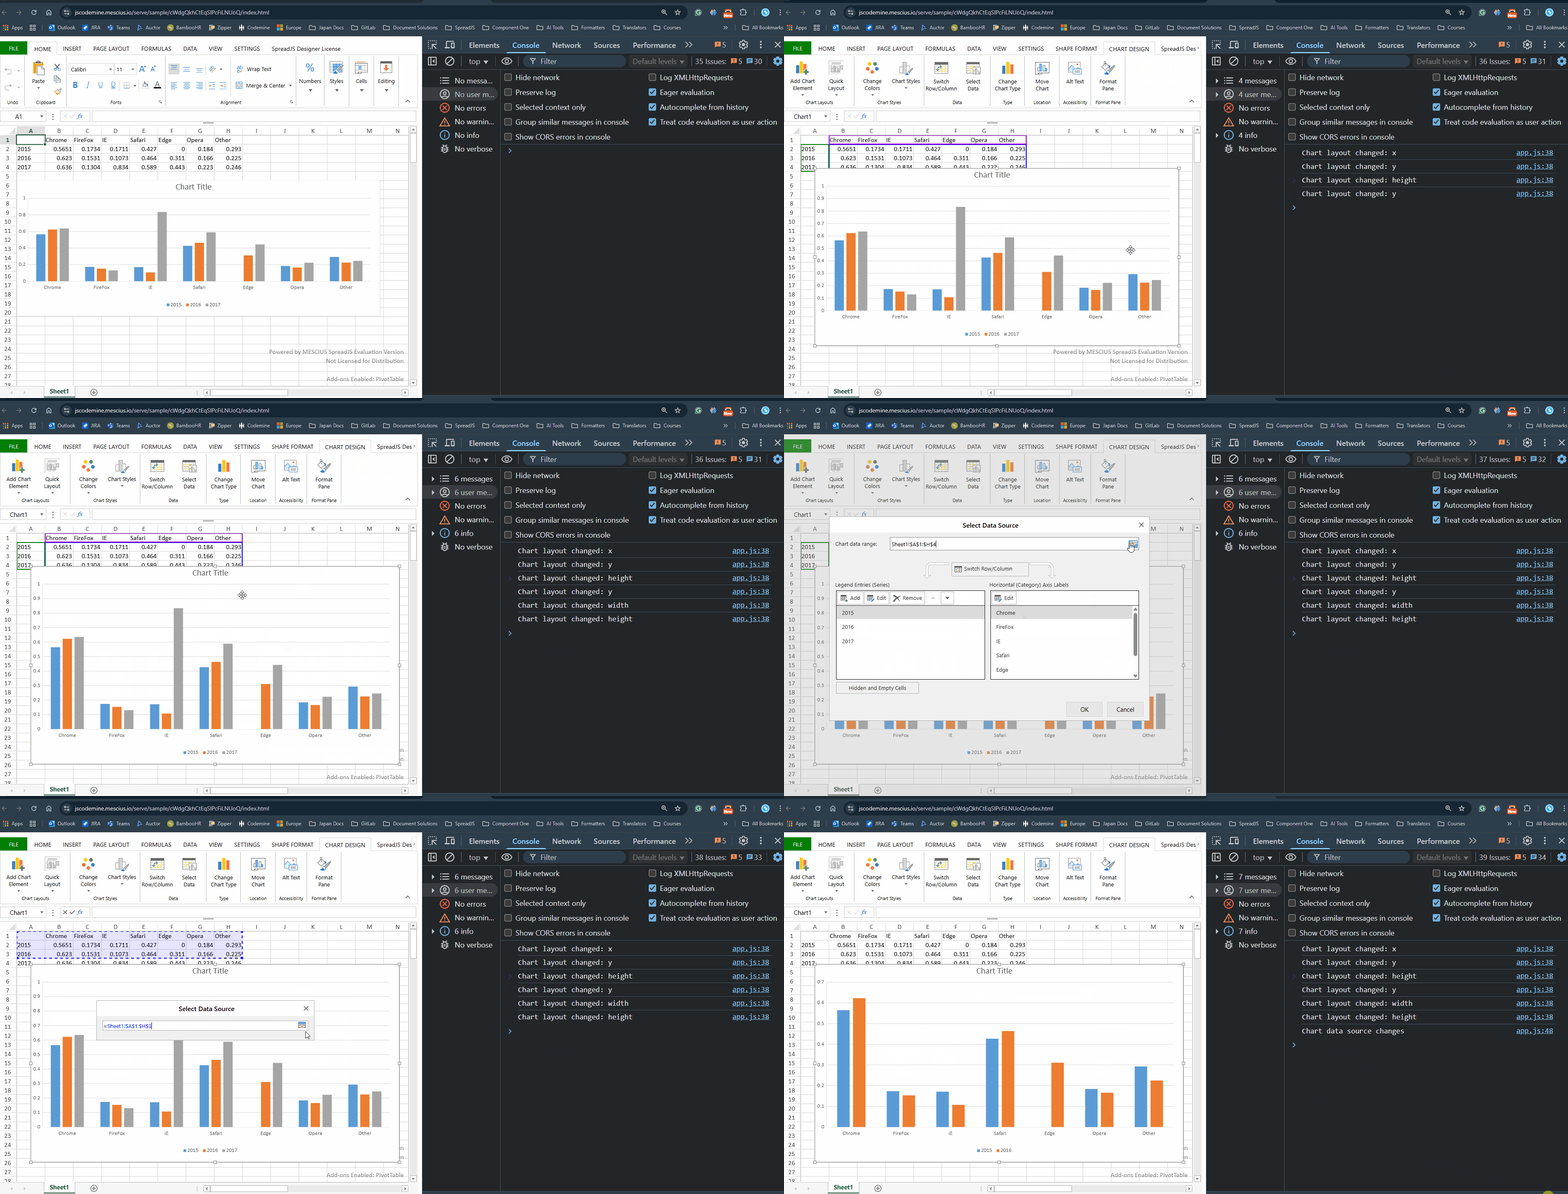
We are currently using SpreadJS in our company, and I’m looking for a way to detect when a user modifies a chart, either by:
- Changing the chart dataset (e.g., updating the data range or series), or
- Adjusting the chart layout (e.g., resizing or repositioning the chart)
I’ve been searching the documentation but haven’t found an event or callback that tracks these interactions. Is there an official way to listen for such changes or a recommended approach to achieve this?
Thank you for your assistance!
Best regards,


