Locking some columns in a Designer SpreadJS Grid w/o Greying out Ribbon Tabs

Posted by: georgeg on 8 April 2025, 11:01 am EST

    • Post Options:
    • Link

    Posted 8 April 2025, 11:01 am EST

    Hi,

    Seems like when you want to lock some columns… and do it this way:

    [code] var designer = GC.Spread.Sheets.Designer.findControl(document.getElementById(‘designerHost’));

    var spread = designer.getWorkbook();

            let sheet = spread.getSheet(0);  
    
            sheet.name(data.reportName);
    
            sheet.setDataSource(data.data);
          
            // Protect the sheet
            sheet.options.isProtected = true;
    
            // Unlock all cells first
            sheet.getRange(-1, -1, -1, -1).locked(false);
    
            //
            console.log("How many columns? :", Object.keys(spreadJsData[0]).length);
            // Lock specific columns (e.g., columns 2, 3, and 4)
            for (var i = 0; i < Object.keys(spreadJsData[0]).length; i++) {
                if (i < 6) {
                    sheet.getRange(-1, i, -1, 1).locked(true); // Lock column B (index 1)
                 }
             }[/code]
    

    …the Designer ribbon tabs like HOME, INSERT, PAGE LAYOUT etc… are still greyed out. Would like to operate on some of the unlocked columns, but I am not sure if there is a way to unlock the tabs on a sheet that only has *some *columns locked?

  • Posted 9 April 2025, 4:32 am EST

    Hi,

    The observed behaviour is by design and expected, and the same as Microsoft Excel.

    It is possible to operate on the unlocked cells of a protected sheet by overriding the designer commands. Please refer to the SpreadJS case - https://developer.mescius.com/forums/spreadjs/protect-sheet#69579, which illustrates how you can change the formatting of the unlocked cells in SpreadJS by using the Designer ribbon.

    Please feel free to reach out if you encounter any further issues or require additional guidance.

    Best Regards,

    Ankit

  • Posted 9 April 2025, 1:53 pm EST - Updated 9 April 2025, 2:22 pm EST

    Well what I really want to do is enable inserting a chart or graph and *then be able to move *that chart or graph to another sheet. Or better yet *enable *the entirety of the ribbon. Maybe I approached the disabled column thing, and I need to rethink that?

  • Posted 10 April 2025, 8:44 am EST - Updated 10 April 2025, 8:49 am EST

    Hi,

    This behavior is by design. However, if you wish to implement the desired functionality, please follow the approaches below:

    Regarding your query:

    “What I really want to do is enable inserting a chart or graph and then be able to move that chart or graph to another sheet. Or better yet, enable the entirety of the ribbon.”

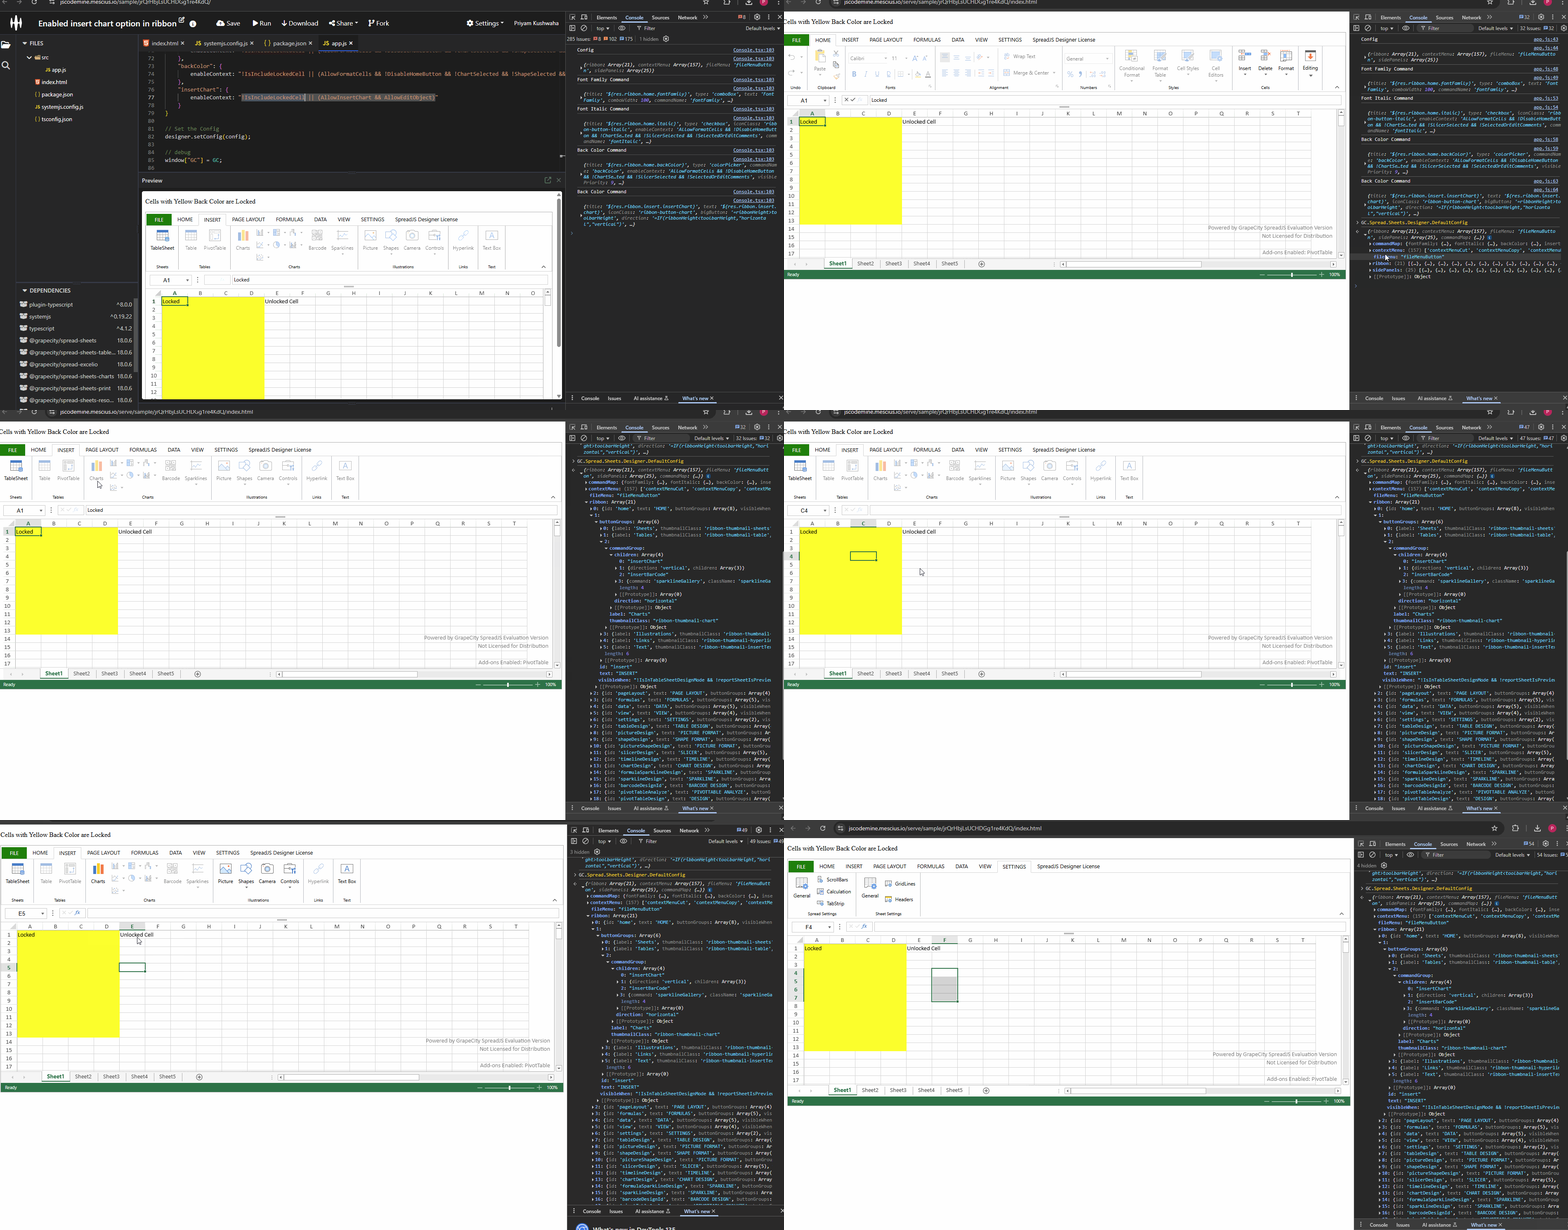
    You can enable chart or graph options in the ribbon for unlocked cells by using the same approach as mentioned earlier—adding !IsIncludeLockedCell in the enableContext. This ensures that when an unlocked cell is selected, the insert chart option becomes active, allowing charts to be added.

    To move the chart to another sheet, you can use the built-in “Move” option available in the context menu when right-clicking on the chart. For this to work, make sure that the “Edit objects” option is enabled while protecting the sheet. Please refer to the attached gif “Steps.gif” and this sample: https://jscodemine.mescius.io/share/k5Tuq3LCl0akVyhpr1j4ww/?defaultOpen={“OpenedFileName”%3A[“%2Findex.html”%2C"%2Fsystemjs.config.js"%2C"%2Fpackage.json"%2C"%2Fsrc%2Fapp.js"]%2C"ActiveFile"%3A"%2Fsrc%2Fapp.js"}

    GIF:

    Similarly, you can enable other ribbon buttons for unlocked cells on protected sheets. To identify all available commands and link them to specific ribbon items, refer to the command list here:

    SpreadJS Designer Command Names - https://developer.mescius.com/spreadjs/api/designer/classes/GC.Spread.Sheets.Designer.CommandNames

    Regards,

    Priyam

  • Posted 10 April 2025, 10:43 am EST

    Ah one more gotcha… So if I would like to include a locked cell as part of the chart or graph would that be doable? What is the recommended approach on making the locked cells “graphable”?

  • Posted 11 April 2025, 2:07 am EST

    Hi,

    Based on my understanding, you’d like to enable the “Insert Chart” option in the ribbon for both locked and unlocked cells.

    To achieve this, you can add “IsIncludeLockedCell || !IsIncludeLockedCell” to the enableContext of the insert chart command. This ensures that the option remains enabled regardless of the cell’s lock status. If you want the option to be available only when a locked cell is selected, then just include “IsIncludeLockedCell” in the enableContext.

    You can refer to the following sample demonstrating how this works:

    https://jscodemine.mescius.io/share/9_B5kVpfTUODop2O506cjg/?IsEmbed=false&Theme=Unset&PreviewDirection=0&IsEditorShow=true&IsExplorerShow=true&IsPreviewShow=true&IsConsoleShow=true&IsRunBTNShow=false&IsResetBTNShow=false&IsOpenInCodemineBTNShow=false&PanelWidth=20&PanelWidth=50&PanelWidth=30&defaultOpen={"OpenedFileName"%3A["%2Findex.html"%2C"%2Fsrc%2Fapp.js"]%2C"ActiveFile"%3A"%2Fsrc%2Fapp.js"}

    In this sample, “IsIncludeLockedCell || !IsIncludeLockedCell” is added to ensure the command is active for both types of cells.

    Regards,

    Priyam

Need extra support?

Upgrade your support plan and get personal unlimited phone support with our customer engagement team

Learn More

Forum Channels