FlexChart Axis Labels - Word Wrap/New Lines

Posted by: reece.gallaway on 18 March 2019, 7:33 am EST

    • Post Options:
    • Link

    Posted 18 March 2019, 7:33 am EST

    Hi,

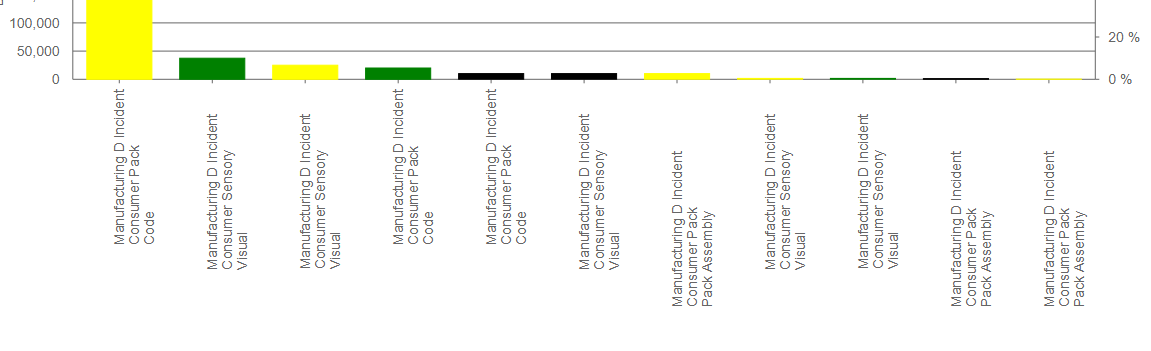
    I’m currently trying to convert our charts from Wijmo 3 to Wijmo 5 and having a few issues. One of which is that we used new line (“\n”) in the text to manually handle text that was too long and causing overlapping, but after upgrading to Wijmo 5 this doesnt work anymore.

    A previous topic has been created to this effect (https://www.grapecity.com/en/forums/wijmo/flexchart-label-wrap_1) but was closed without any reference to a bug entry etc.

    I know that you are using SVG now to render the chart components, so are you using SVG 2? As this includes auto text wrapping (https://svgwg.org/svg2-draft/text.html#TextLayoutAuto), just need to declare a text area thats the same width as the x axis plot point.

    If this is already raised and given a bug reference, can you reiterate the reference and give a link to the original issue?

    Also I should point out that I have seen suggestions of rotating the labels by -45 so they dont overlap or abbreviating them and using tooltips to display the full text, but neither of these really work in our situation.

    Thanks,

    Reece

  • Posted 20 March 2019, 6:47 am EST

    Hi Reece,

    In Wijmo5 charts, as the default setting, we chart automatically hide the labels if they overlap. But if you would like to handle the labels yourself using linebreaks then you need to follow the following steps:

    1). Turn off default feature to hide labels on overlapping by setting overlappingLabels property of the chart axis.

    API ref: https://demos.wijmo.com/5/Angular/WijmoHelp/WijmoHelp/topic/wijmo.chart.Axis.Class.html#overlappingLabels

    2). Handle the rendered event and update the axis.

    Please refer to the following sample and let us know if you face any further issues:

    https://jsfiddle.net/ashwin2409/cedk4u3z/

    ~Sharad

  • Posted 21 March 2019, 10:32 am EST

    Thanks Sharad,

    That works perfectly :slight_smile:

    However, is there a way to get the width of the bars? All our charts go through a set of shared code, it used to work out the size of the bars to know when to add a line break but that doesnt seem to be working anymore.

    I’d rather not have to do this manually per chart if possible!

    R

  • Posted 22 March 2019, 1:18 am EST

    To achieve a fixed bar size in case of bar/columns chart, all we need to do is set the groupWidth options on the chart like:

    flexChart.options = {
    	groupWidth: 30
    }
    

    API ref: https://demos.wijmo.com/5/Angular/WijmoHelp/WijmoHelp/topic/wijmo.chart.FlexChart.Class.html#options

    You may also refer to the following sample demonstrating the same: https://jsfiddle.net/mck82osn/3/

    We are sorry but there is not way to set this as a default value for all the charts, we need to set groupWidth on each chart instance individually.

  • Posted 22 March 2019, 7:26 am EST

    Hi,

    Is there a way to get the width on the rendered event or something?

    The data is driving the charts mainly, so their size can vary a lot depending on how much data the user has returned for their query.

    Think we may use the abbreviation method if we cant get the size of the bars (we also used to move the data label to sit atop the bar using that info, so we cant do that either now)

    Thanks,

    Reece

  • Posted 26 March 2019, 2:37 am EST

    Hi Reece,

    We are sorry but there is no direct way to get the width of the rendered group. What we could do is grab the plot area and gets its width then divide it by the number of items. Please refer to the following code snippet:

    let pArea =  chart.hostElement.querySelector('.wj-plot-area > rect');
    let pAreaWidth = pArea.width.baseVal.value;
    let groupWidth = pAreaWidth / (chart.collectionView.items.length || 1);
    

    we also used to move the data label to sit atop the bar using that info, so we cant do that either now

    We could easily get the required functionality by setting data labels for chart. Please refer to the following sample demonstrating the same:

    https://demos.wijmo.com/5/PureJS/LearnWijmo/LearnWijmo/#1g783zxx

  • Posted 26 March 2019, 10:56 am EST

    Thanks Sharad,

    We’ll have a play around with that and see if we can get something similar to how it looked before.

    One final question, we have up to 3 charts on screen with different data that need to have their max and min Y axis values sync’d up.

    What we us to do is grab these values from the chart and then set the max and min to be the largest and smallest of the returned values respectively.

    It now seems to be returning undefined/nothing instead of the Max Y value calculated by the chart, is there a way to get this value? Does it have to be gathered at a later stage, like at the “rendered” event or something? Do you have any ideas how we can replicate the same effect?

    E.g. if chart 1 has a dataset with a Max of 1000 and Min of 100, chart 2 has Max of 400 and Min of -300, both charts would have their Max set to 1000 and Min to -300, so you can compare them easily as they are on the same scale.

  • Posted 28 March 2019, 5:08 am EST

    >> Synching the values of Y-Axis

    The values of max and min in Y-axis will be undefined until you set them explicitly. You can use the values of actualMax and actualMin in order to sync the charts by handling the rendered event. Save the values of actualMax and actualMin of all the charts and when all the values have been added, sync the max and min for all the charts. Please refer to the following sample:

    https://jsfiddle.net/ashwin2409/2yLbf3kg/

    >> we also used to move the data label to sit atop the bar using that info, so we can’t do that either now

    When you add data labels in the chart, we could handle the dataLabel’s rendering event to control how the data labels are added and position the dataLabels as required. Please refer to the following code snippet:

    chart.dataLabel.rendering.addHandler(renderLabel);
       function renderLabel(sender, e) {
            var hitTestInfo = e.hitTestInfo;
            var chart = hitTestInfo.chart;
            var items = hitTestInfo.series.collectionView.items;
            var val = items[hitTestInfo.pointIndex].downloads;
    
            // custome rendering for negative values only
            if (val < 0) {
                var valStr = wijmo.Globalize.format(val, 'n0');
                var pt = chart.dataToPoint(hitTestInfo.pointIndex, 0);
                var size = e.engine.measureString(valStr);
                pt.x -= size.width / 2;
                e.engine.drawString(valStr, pt, 'wj-data-label');
                e.text = '';
            }
        }
    

    You may also refer to the sample shared above.

  • Posted 29 March 2019, 5:53 am EST

    Thanks very much, this is just what we were looking for :slight_smile:

    The only problem we have left is that you can visible see the charts resize, as its a dashboard there will be many of these charts on there so will be a little jarring see most of them redraw themselves.

    I think we could maybe move the max/min calculations to before the chart is being rendered, that would mean it wouldnt have to resize itself after being drawn, but if you have any other suggestions I’d be happy to hear them

    Reece

  • Posted 2 April 2019, 5:16 am EST

    We are sorry, but the values of actualMin and actualMax are calculated for the first during the rendering event. So, before rendering, the values of actualMin and actualMax are undefined so we cannot use them.

  • Posted 2 April 2019, 5:44 am EST

    Thanks Abhishek,

    I’ll mark Sharad’s response as the answer then, guess we’ll have to work out the max value from the data before the charts are drawn.

    Thank you both for your help.

    Regards,

    Reece

  • Posted 5 March 2020, 12:12 am EST

    Hi Madhu,

    Please refer to the link below for a sample in Angular and Wijmo:

    https://stackblitz.com/edit/angular-mkpotn

    Regards,

    Ashwin

  • Posted 5 March 2020, 12:50 am EST

    Can you please share sample code for Overlapping X-axis values with new line/wordwrap in Angular 8 version and for Wijmo 5 version.

    Thanks in advance.

    Madhu

  • Posted 5 March 2020, 3:11 am EST - Updated 3 October 2022, 5:08 pm EST

    Thanks Ashwin . This works for word wrap. But, the x-axis value are not uniform.

    We can see third and second x-axis values are having space between tick and the value. Can you please help me this.

  • Posted 6 March 2020, 1:12 am EST

    Hi Madhusri,

    It seems that the Y-Axis values of the labels are not set properly. You will need to change the coordinates of the labels according to the text length.

    ~regards

  • Posted 6 March 2020, 1:17 am EST

    I have rendered setting as below:

    ex.setAttribute(‘x’, (x + 150).toString());

    ex.setAttribute(‘y’, (y + 15 * index).toString());

    How do I set it?

    onRendered(s, e) {

    const labels = document.querySelectorAll(‘.wj-axis-x .wj-label’);

    labels.forEach((value, key, parent) => {

    const x = +value.getAttribute(‘x’);

    const y = +value.getAttribute(‘y’);

    const text = value.innerHTML.split(‘\n’);

    value.innerHTML = ‘’;

    text.forEach((item, index) => {

    const ex = document.createElementNS(‘http://www.w3.org/2000/svg’, ‘tspan’);

    ex.setAttribute(‘x’, (x + 150).toString());

    ex.setAttribute(‘y’, (y + 15 * index).toString());

    ex.innerHTML = item;

    value.appendChild(ex);

    });

    });

    }

  • Posted 6 March 2020, 1:56 am EST

    Hi Madhusri,

    The new coordinates of the X and Y axis that I provided were according to the layout of my page and also the data source of the FlexChart.

    In your application, you will need to configure the coordinates according to your layout. Update these values here:

    
    // change the second parameter 
    // according to the layout
    e.setAttribute("x", (x + 50).toString());
    e.setAttribute("y", (y + 15 * index).toString());
    

    ~regards

Need extra support?

Upgrade your support plan and get personal unlimited phone support with our customer engagement team

Learn More

Forum Channels