Posted 14 September 2017, 11:14 am EST
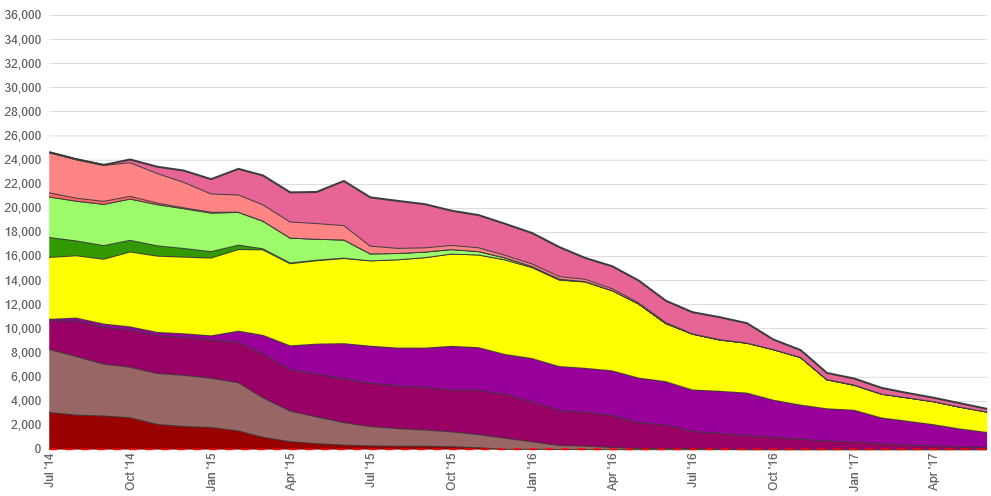
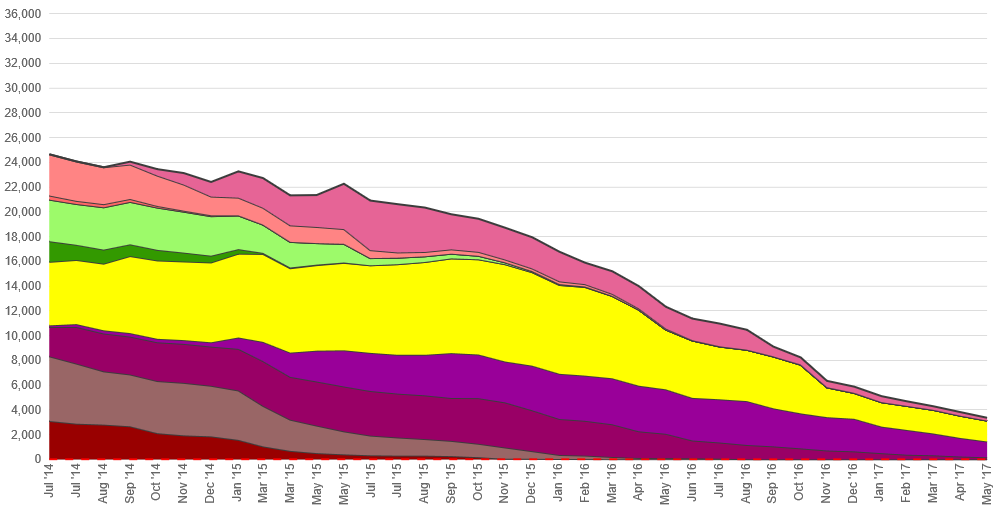
This doesn’t really give me what I want (unless I’m misunderstanding something). Per our customer requirements, we need to show the date axis labels for every month, rotated 90 degrees, and in the format “MMM 'yy”. I can pull off the rotation and formatting easily enough with the ‘format’ and ‘label-angle’ directives. But you’ll notice in the Chart1 image attached, there is still plenty of room to show the labels for each month, but the chart only displays every three months. If I set the ‘major-unit’ directive to 30.4375 (average days per month), I get labels as shown in the Chart2 image attached. You can see that this causes some duplicate and skipped labels because of the inconsistent days for each month. Is there a way for us to satisfy this customer requirement of showing every month correctly?
Thanks,
Terry