
Posted 4 December 2019, 12:50 pm EST - Updated 3 October 2022, 6:32 pm EST
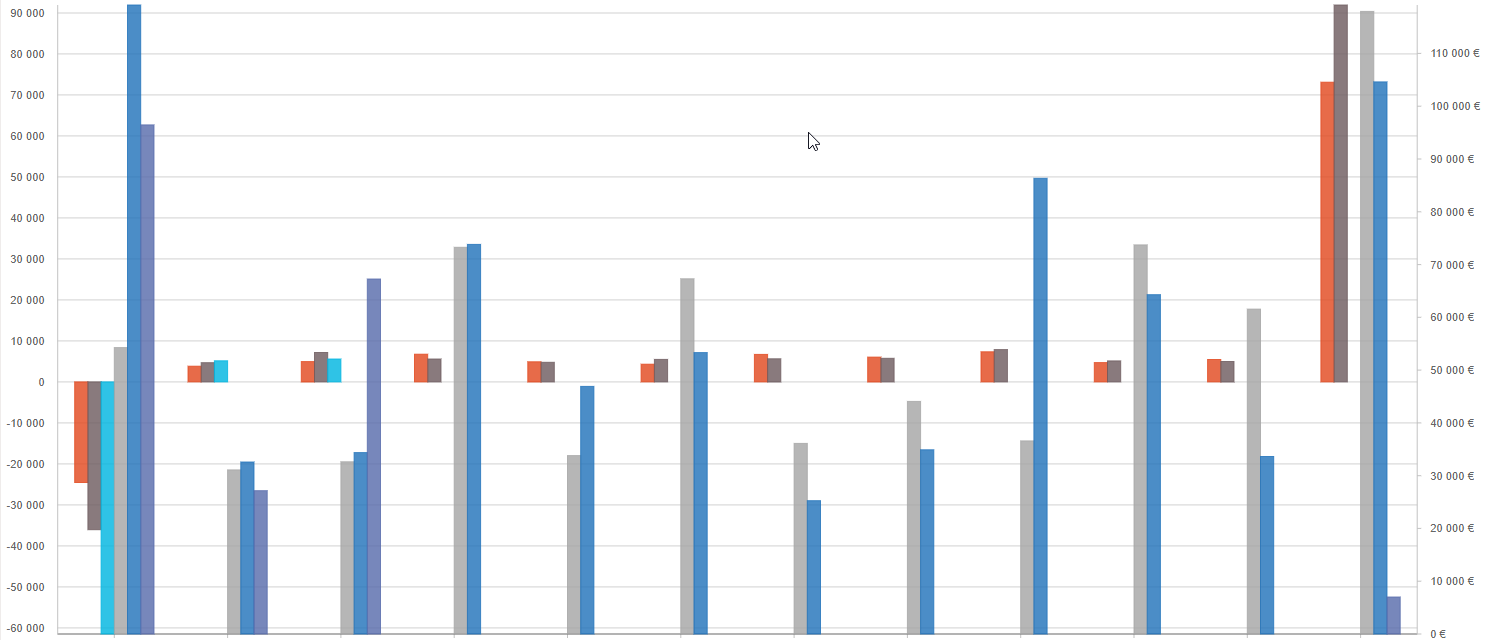
We are using two axis on our graphics, with several series on each one. For instance (3 first series on left, 3 others on right) :
However, when we mix histogram/line representation for some series, the graphic is sometimes corrupted, wrongly superposing the data. For the same example as above, the only change made is that the first series on the right axis is now in line format:
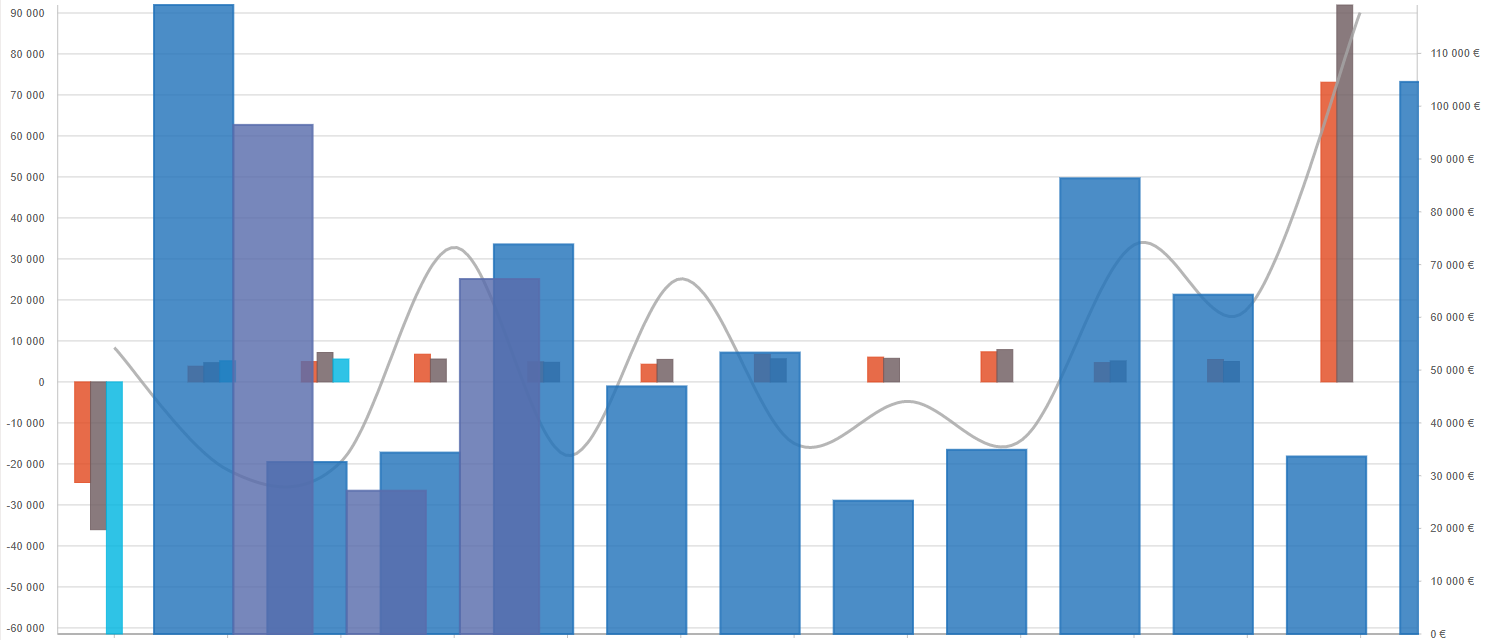
I would like to know is this is a know bug and if there is some workaround it.
Thanks in advance.


