Posted 26 July 2019, 5:34 am EST
Hi Team,
In a pivot grid that contains two rowFields and three columnFields, please let me know how to add a column as a normal column field without defining it as a rowField/valuefield.
Thanks.
Forums Home / Wijmo / General Discussion
Posted by: chandrasekar_keerthana on 26 July 2019, 5:34 am EST

chandrasekar_keerthana
Posted 26 July 2019, 5:34 am EST
Hi Team,
In a pivot grid that contains two rowFields and three columnFields, please let me know how to add a column as a normal column field without defining it as a rowField/valuefield.
Thanks.

ashwin.saxena
![]()
Posted 29 July 2019, 7:51 am EST
Hi,
We are sorry but you cannot add a column directly to PivotGrid. But, you could hide the column/row field using the visible property, so that the field will not be visible on the PivotPanel and the user cannot add or remove the field. Please refer to the code snippet below:
var ngPanel = new wjcOlap.PivotEngine({
  itemsSource: getData(1000),
  rowFields: ['Country', 'Product'],
  valueFields: ['Sales', 'Downloads', 'Amount'],
});

ngPanel.fields.getField('Product').visible = false;
Also, could you please tell us why do you need to add an unbounded column to the PivotGrid?
Regards,
Ashwin
chandrasekar_keerthana
Posted 30 July 2019, 10:20 am EST - Updated 3 October 2022, 7:15 pm EST
Hi Ashwin,
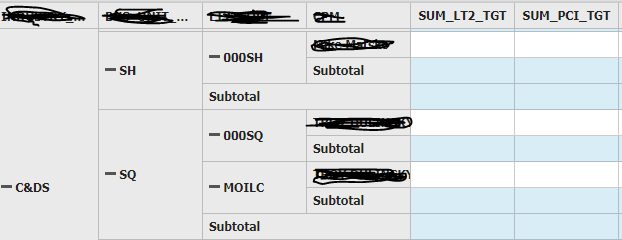
Please refer to the screenshot attached. Currently the subtotal is getting displayed till the fourth column. Is there a way to limit it to the third column alone?
Thanks.
ashwin.saxena
![]()
Posted 31 July 2019, 12:06 am EST
Hi,
To achieve the desired behavior, you may handle the loadedRows event of PivotGrid and hide those rows whose level is 3 (since you wish to hide subtotals for 4th column so the level is 3). Please refer to the code snippet and sample below:
var pivotPanelGrid = new wjcOlap.PivotGrid('#pivotPanelGrid', {
  loadedRows: function(s, e) {
    s.rows.forEach(r => {
      if(r.dataItem.$rowKey.level === 3) {
        r.visible = false;
      }
    })
  },
  itemsSource: ngPanel,
});
https://stackblitz.com/edit/js-5yydzw
Regards,
Ashwin
chandrasekar_keerthana
Posted 31 July 2019, 3:48 am EST
Hi,
This workaround seems to work only on the initial load. As soon as I collapse and expand the item in the 3rd column, the subtotal appears back on the column 4 item. Please let me know if there’s any other handler to achieve this.
Thanks,
Keerthana
ashwin.saxena
![]()
Posted 31 July 2019, 6:30 am EST
Hi Keerthana,
Sorry for the inconvenience.
The loadedRows is the only event that can be used in your use case but it does not fire when the collapsed state of a group is changed. We can solve this issue by handling the mousedown event on the PivotGrid and if the target is a group collapse icon, we can call loadedRows again.
Also, when we collapse a group in PivotGrid, the group shows the subtotal of the field in the remaining row. But, in the 3rd column, there is no subtotal row so, in the collapsed state, the row does not have any data to show. Therefore, I would suggest you to either remove the collapsible group for the whole grid or only for the 3rd column.
You may remove the collapsible groud for the whole grid by setting the collapsibleSubtotals property of PivotGrid to false.
But, if you wish to hide the collapsible group only for the 3rd column, you may use the cellFactory of PivotGrid and remove the (+/-) icon from the row. Please refer to the updated sample that demonstrates the above behavior:
https://stackblitz.com/edit/js-qyfo3m
Regards,
Ashwin
chandrasekar_keerthana
Posted 6 August 2019, 6:32 am EST
Hi Ashwin,
Thank you so much for your response. It worked for me after making few changes.
I have one more question on the “Filter” option present in the pivot panel. After dragging a column under the filter, as per excel behavior I am seeing the column is removed from the pivot table and added to the top row with the filter by value enabled. Based on the value selected in this field, the pivot table value also changes. But in Wijmo’s pivot grid, the column dragged under “Filter” is only getting removed from the grid and filter isn’t getting enabled. Please let me know the expected behavior here.
Thanks,
Keerthana
ashwin.saxena
![]()
Posted 7 August 2019, 2:17 am EST
Hi Keerthana,
Yes, this is the expected behavior. The filter fields allow us to filter the data but they are not used as dimensions. If you wish to apply filters on the fields, you will need to open the Field Settings dialog by right-clicking on the filter field and then editing the filter.
Let us know if you have any further queries.
~regards
chandrasekar_keerthana
Posted 17 September 2019, 5:44 am EST
Hi Ashwin,
Thanks for your response. If that’s a behavior, I don’t see much of a use for the filter icon in the pivot panel. Please let me know if I’m missing anything here.
Also, is it possible to have show the filter enabled with a filter icon in the column header, similar to flexgrid/flexsheet?
Thanks.

sharad.tomer
![]()
Posted 18 September 2019, 6:47 am EST
Hi Keerthana,
Filter icons in the panel are displayed to indicate which fields have active filters. We could apply filters on any field, but only the row, column and value filters are used to filter the actual data. In addition to these, the filter of filter fields are also used to filter data but these(filter fields) are not used to generate the data view. So if need we to filter data based on a field but do not wish to include it in the generated data view, we use the filter fields.
Hope this clears, please let us know if you still have some confusion.
Also, is it possible to have show the filter enabled with a filter icon in the column header, similar to flexgrid/flexsheet?
We could handle the formatItem event and add the filter icons as required. Please refer to the following sample which demonstrates the same:
https://stackblitz.com/edit/js-erpdnn?file=index.js
In the above sample if we apply the filter on a field then the filter icon is shown in the column headers for the equivalent field.
Regards
Sharad
chandrasekar_keerthana
Posted 20 September 2019, 8:27 am EST - Updated 3 October 2022, 7:15 pm EST
Hi,
I’m not sure if we’re talking about the same filter field. Please refer to the screenshots attached. I wanted to know the behaviour of the yellow highlighted filter field present in the drag and drop section of the pivot panel.
Also I want the filter icon in the header with the click event enabled to display the filter pop up corresponding to that column.
Thanks,
Keerthana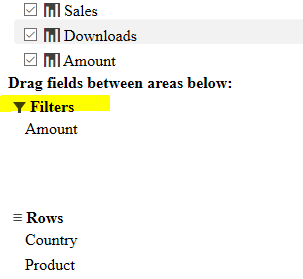
ashwin.saxena
![]()
Posted 23 September 2019, 3:18 am EST - Updated 3 October 2022, 7:16 pm EST
Hi Keerthana,
The fields that are added to the filter fields column in the PivotPanel are only used for filtering. They are not used to create the data view. If you will apply a filter on a filter field, the values in the PivotGrid will be filtered out accordingly. The same goes with the row, column, and the value fields. The only difference is that the row, column, and the value fields will be shown on the PivotGrid but the filter fields will not.
Also, if you will remove a field from the filter field but do not add it to any of the other fields, the data will not be filtered out.
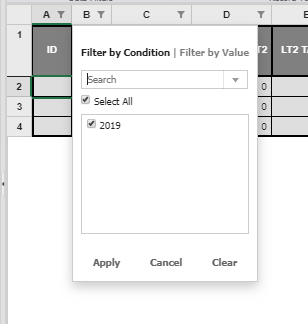
For a demonstration, please refer to the sample below and the screenshot attached:
https://stackblitz.com/edit/js-smr8nw
In the screenshot, observe that when I remove the amount field from the filter fields, the filter in the PivotGrid is removed as the data updates and if I add it back then the data is updated according to the filter.
I hope this will clear all the doubts but let us know if you still have any queries.
Regarding popup filters:
You may popup filter editor by using the FlexGridFilter class but I would not suggest you do so because adding filters using the FlexGridFilter will not be in sync with the PivotEngine and data shown may be incorrect.
~regards
chandrasekar_keerthana
Posted 23 September 2019, 6:00 am EST
Hi Team,
Thanks for the clarification. It helps.
Thanks,
Keerthana


