Show the text of the datapoint in axis of flexchart other than binding value

Posted by: abhatt on 23 April 2020, 7:31 pm EST

    • Post Options:
    • Link

    Posted 23 April 2020, 7:31 pm EST - Updated 3 October 2022, 4:32 pm EST

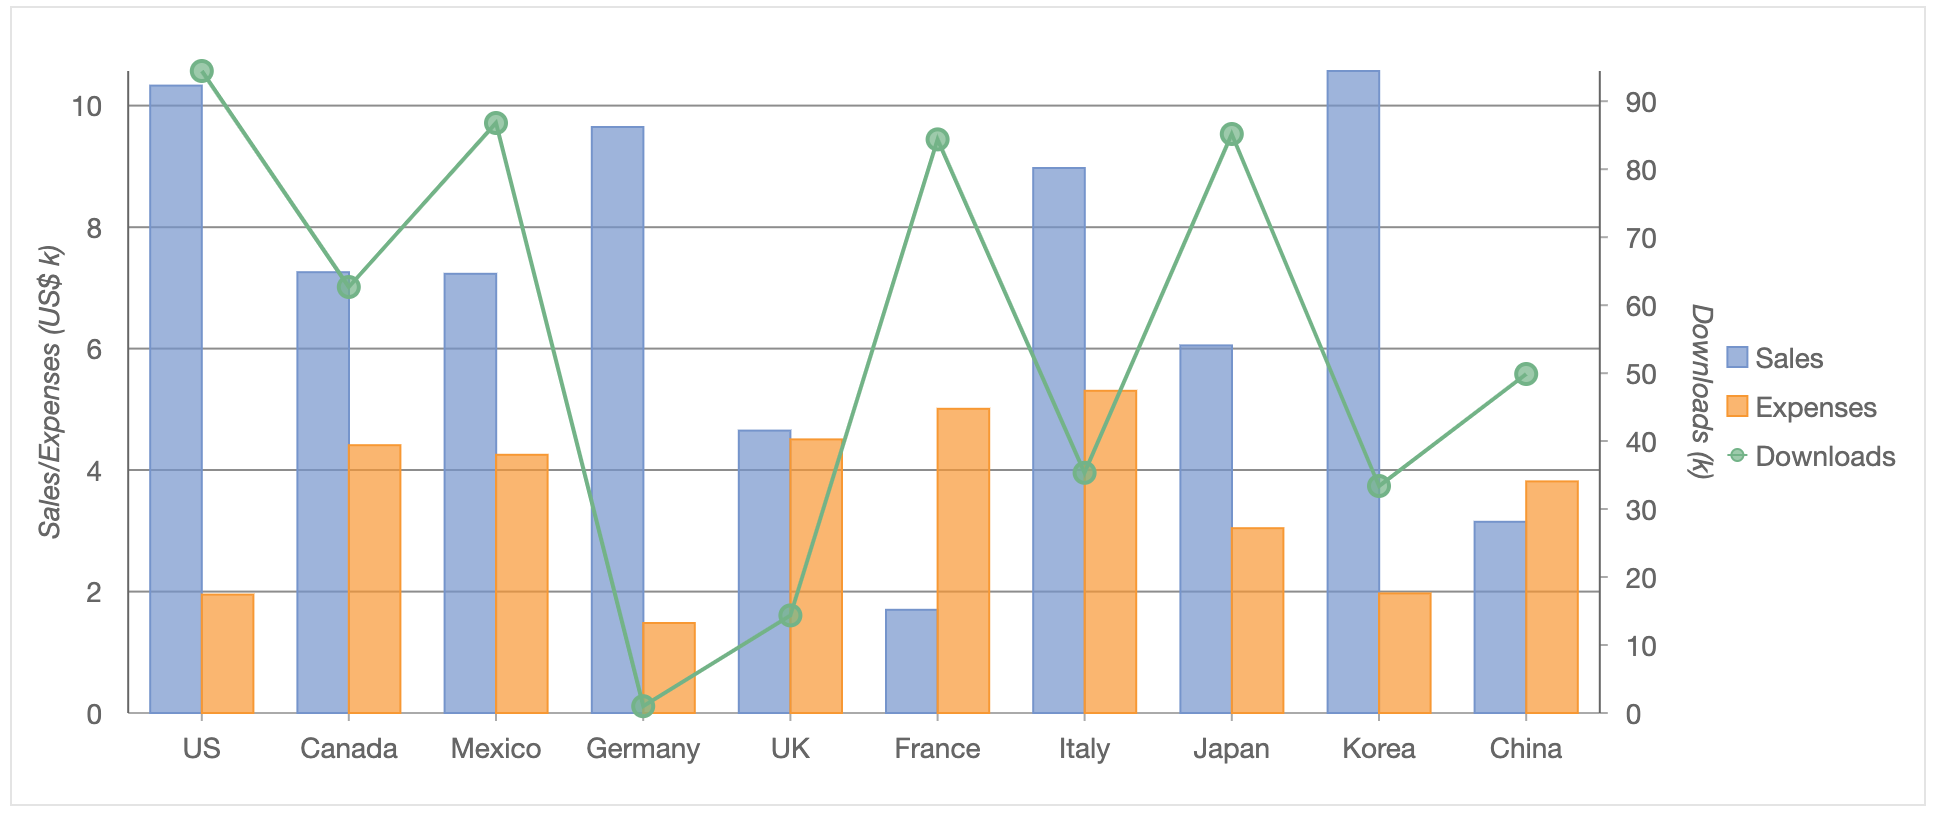
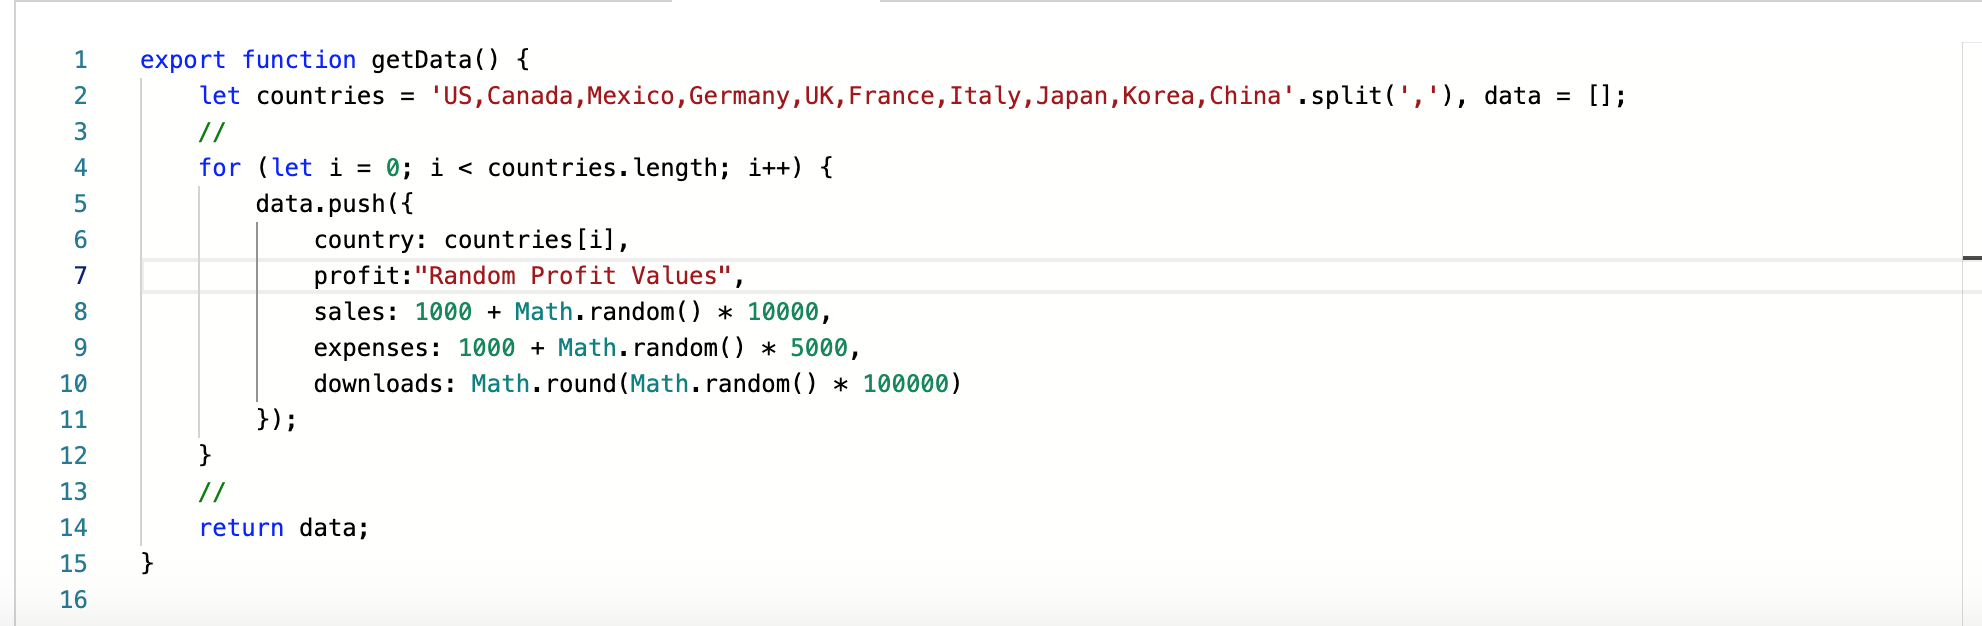
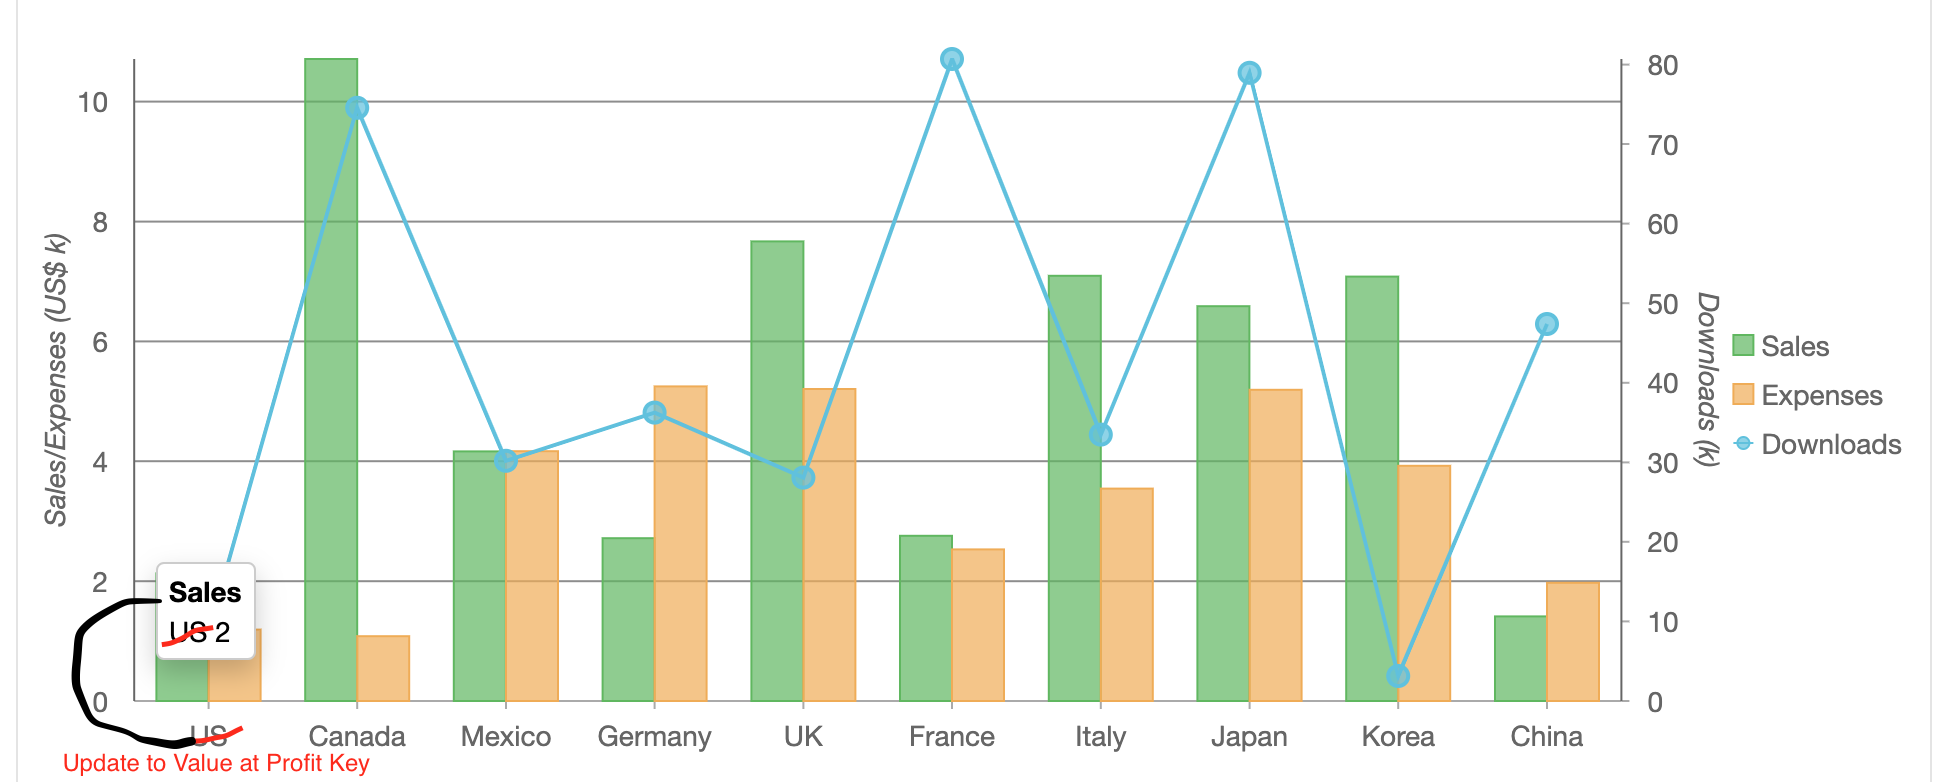
    For Example my data object have key columns as country,profit,sales,expenses,downloads. Binding at X-axis during initialization of series uses binding value as “Country”. It Still uses Country key for binding the axis but it display the value at the point on the x-axis not the country value but the value present at profit key column.

  • Posted 23 April 2020, 7:35 pm EST

    If the Profit at data Object of Country US is for example 50%, so instead of US in the axis it should show 50 while keeping the binding property to be country.

  • Posted 24 April 2020, 1:49 am EST

    Hi,

    To change the labels in the x-axis, you can use the itemFormatter callback:

    axisXFormatter(engine, lbl) {
          var items = this.state.data[lbl.val];
          lbl.text = wjcCore.Globalize.formatNumber(items.profit, 'p2');
          return lbl;
    }
    

    And to change the tooltip content, simply change the content property of the chart’s tooltip accordingly:

    flex.tooltip.content = '<b>{seriesName}</b><br/>{profit:p2} {y}'
    

    Refer to the sample below:

    https://stackblitz.com/edit/react-jtmec1

    API:

    tooltip: https://www.grapecity.com/wijmo/api/classes/wijmo_chart.charttooltip.html#content

    itemFormatter: https://www.grapecity.com/wijmo/api/classes/wijmo_chart.axis.html#itemformatter

    Regards,

    Ashwin

Need extra support?

Upgrade your support plan and get personal unlimited phone support with our customer engagement team

Learn More

Forum Channels