Posted 17 June 2021, 7:53 am EST - Updated 3 October 2022, 1:36 pm EST
Hi,
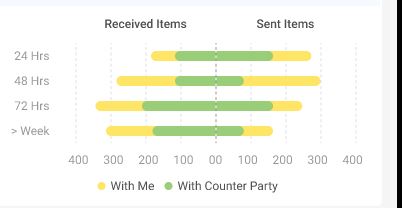
can anyone give a sample like the above attached chart using wijmo flexchart in angular?
Forums Home / Wijmo / General Discussion
Posted by: teenu.k on 17 June 2021, 7:53 am EST

teenu.k
Posted 17 June 2021, 7:53 am EST - Updated 3 October 2022, 1:36 pm EST
Hi,
can anyone give a sample like the above attached chart using wijmo flexchart in angular?

ashwin.saxena
![]()
Posted 21 June 2021, 1:50 am EST
Hi Teenu,
This is possible. You can use a bar chart to create this type of chart with stacking enabled. But, the data item should contain all the values of the chart in a single item and the received items should be negative value so that it is displayed on the left side of the origin. Then you can use the itemFormatter for the axis and tooltip content to display -ve values as positive. Please refer to the sample link below for reference:
https://stackblitz.com/edit/angular-nace6b
Regards,
Ashwin


