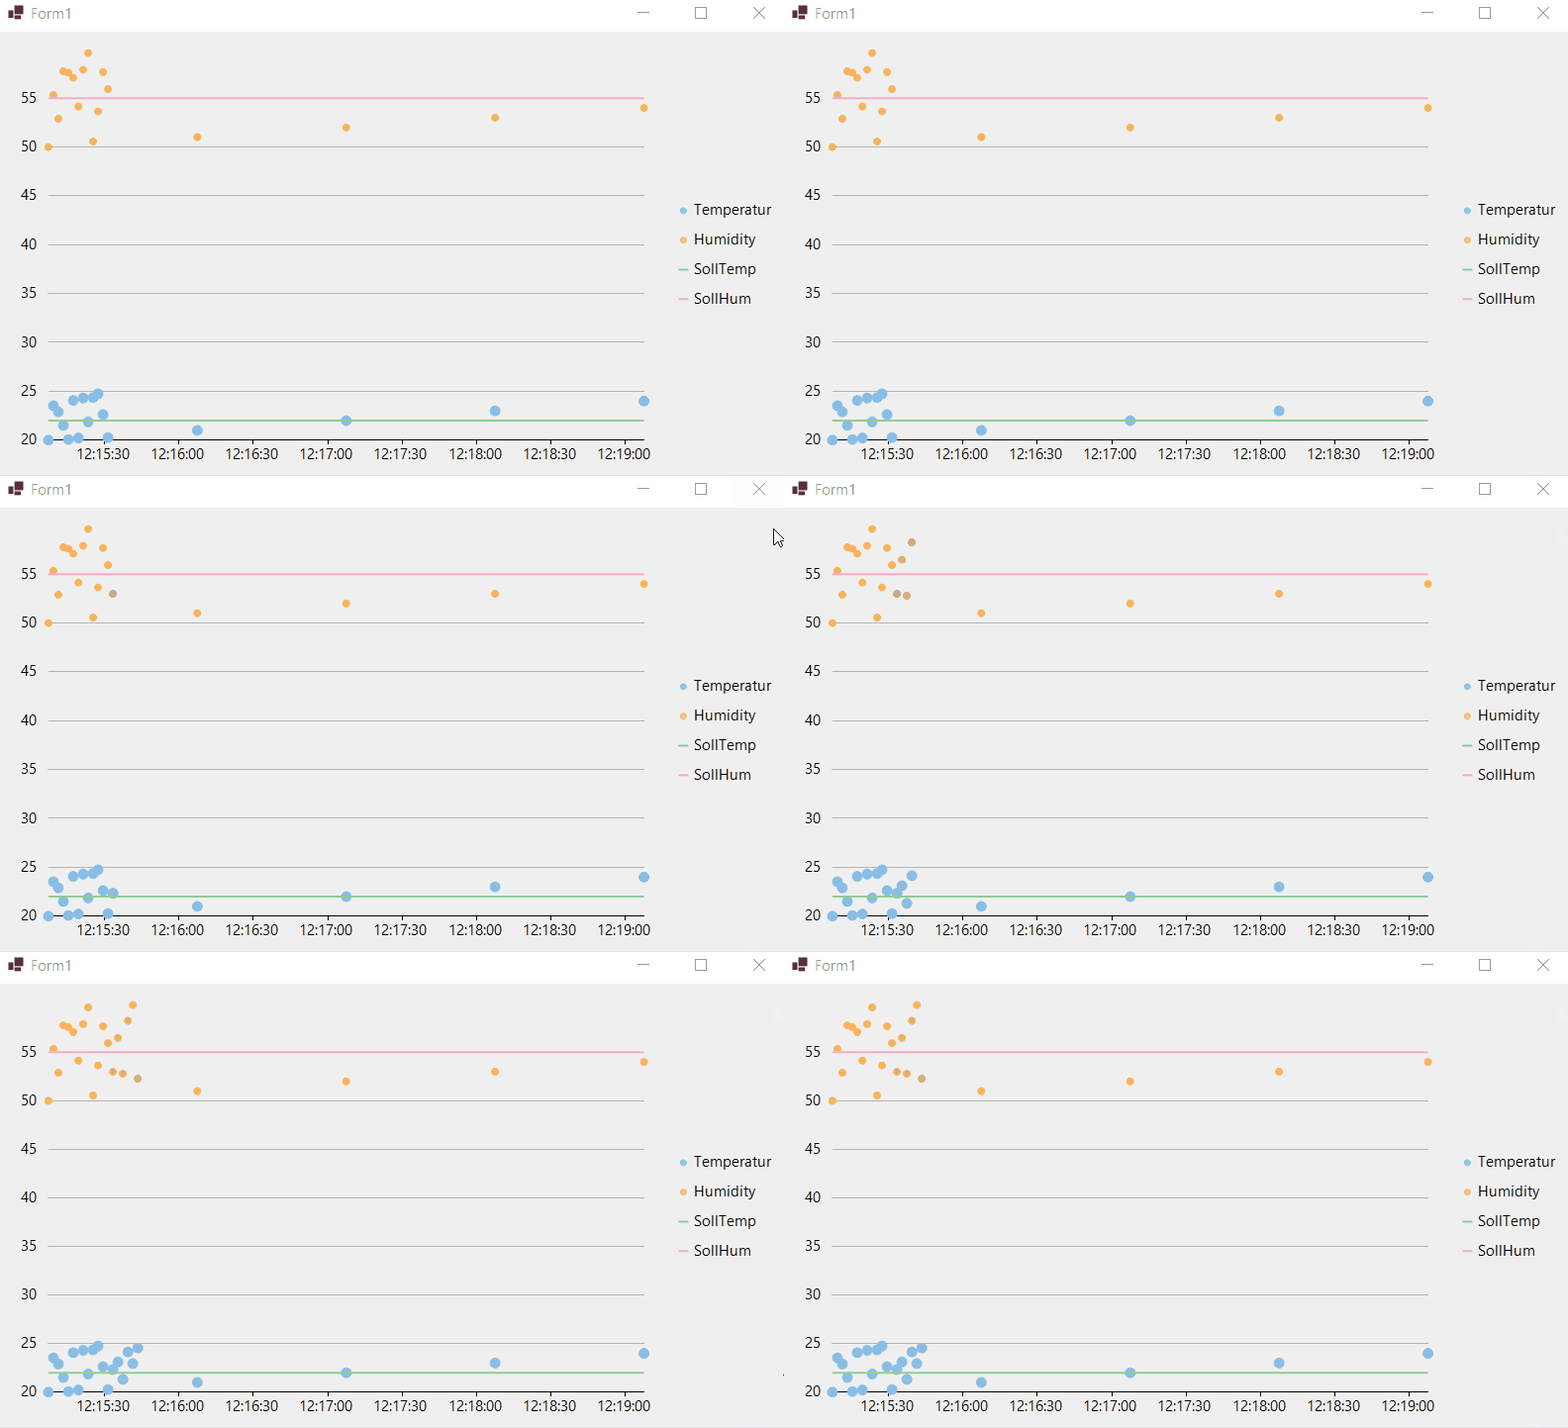
Adding Points to the underlying datasource doesnt show anything

Posted by: cnoelle on 15 July 2025, 7:01 am EST

    • Post Options:
    • Link

    Posted 15 July 2025, 7:01 am EST

    I have a datasource

    Class DataItem
        Public Property istTemp As Single
        Public Property istHum As Single
        Public Property sollTemp As Single
        Public Property sollHum As Single
        Public Property dt As DateTime
    End Class

    which is bound to a flexchart

    [code] FlexChart1.BeginUpdate()

    FlexChart1.Series.Clear()

    FlexChart1.ChartType = C1.Chart.ChartType.Line

    FlexChart1.DataSource = _dataItems

    FlexChart1.BindingMode = BindingMode.Direct

    FlexChart1.BindingX = “dt”

     FlexChart1.Series.Add(New Series() With {.Name = "Temperatur", .Binding = "istTemp", .ChartType = ChartType.Scatter, .SymbolSize = 10})
     FlexChart1.Series.Add(New Series() With {.Name = "Humidity", .Binding = "istHum", .ChartType = ChartType.Scatter, .SymbolSize = 7})
     FlexChart1.Series.Add(New Series() With {.Name = "SollTemp", .Binding = "sollTemp"})
     FlexChart1.Series.Add(New Series() With {.Name = "SollHum", .Binding = "sollHum"})
    

    [/code]

    any more points appended to _dataitems are not recorded.

    Why does any

    refresh

    rebind

    update

    BindingMode.Direct

    etc

    on the flexchart and also individual series do nothing? What is meant by binding?

    Regards

  • Posted 16 July 2025, 3:00 am EST - Updated 16 July 2025, 3:05 am EST

    Hi Chris,

    Thanks for sharing the code snippet.

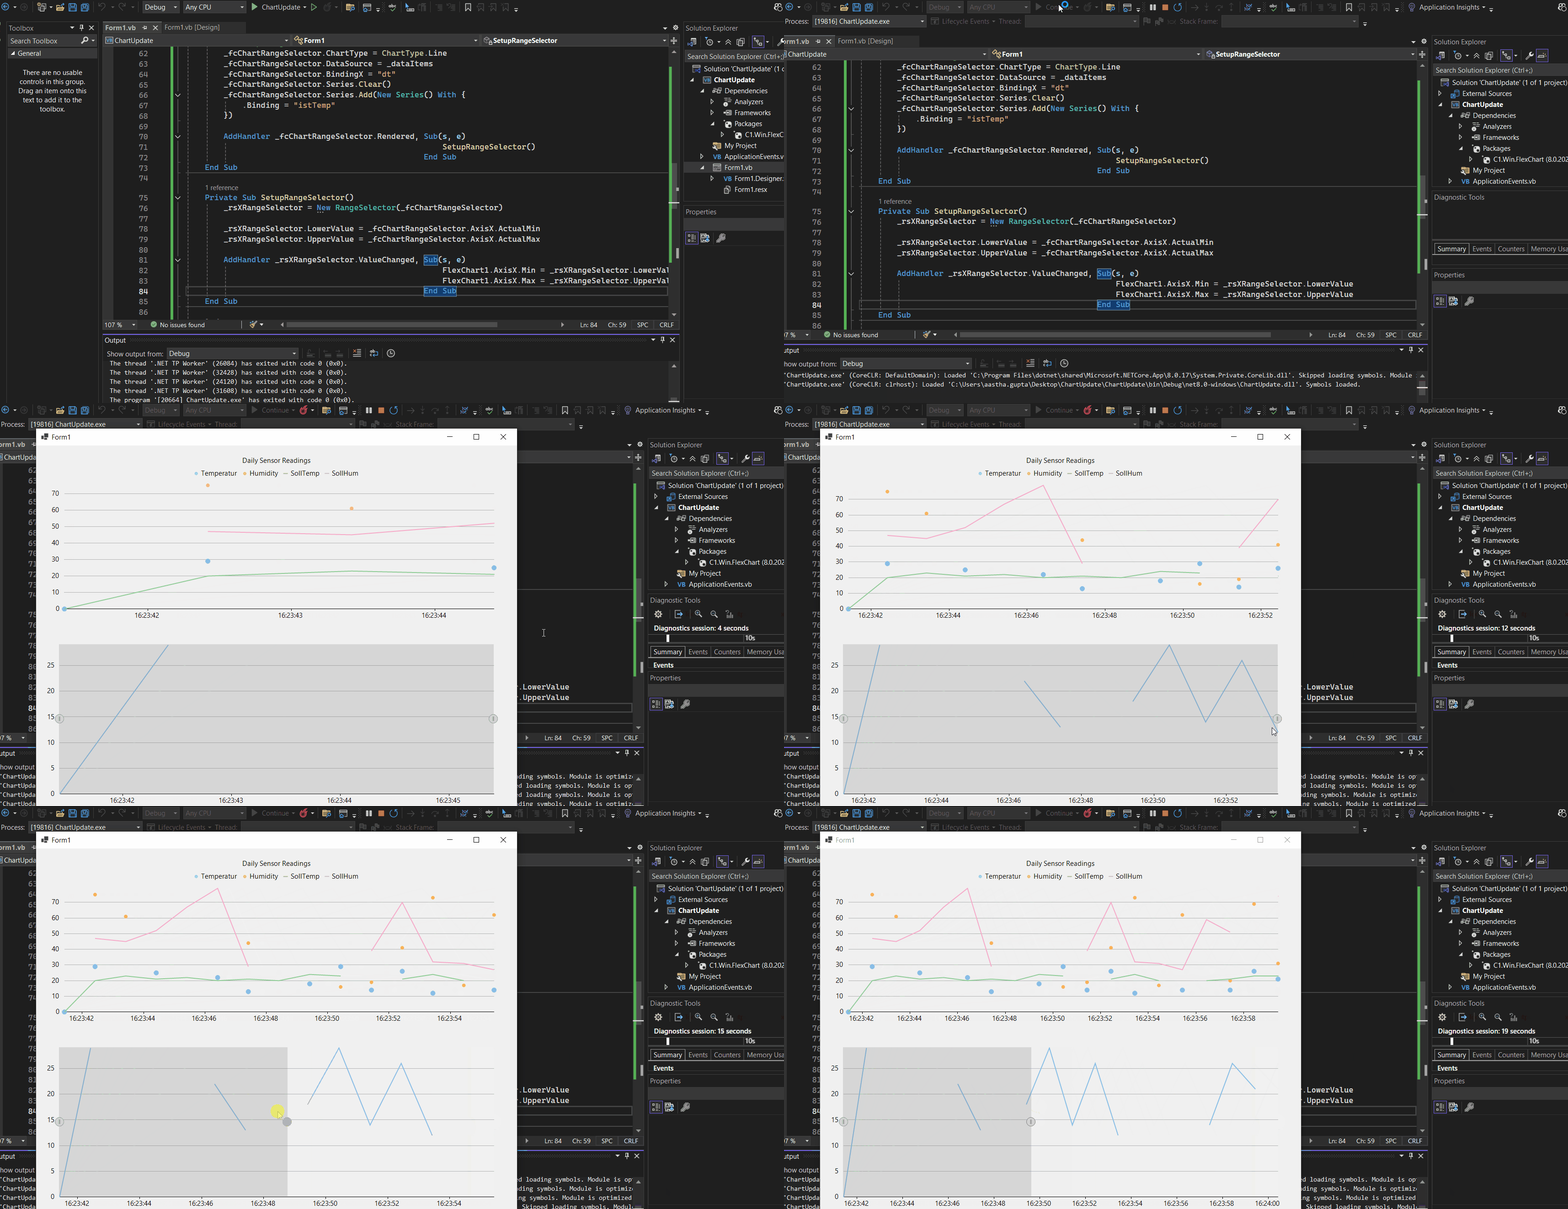
    We used your code to create a sample application, and in our testing, updates to the _dataItems list are reflected correctly on the chart. Please see the following GIF for reference:

    We’ve also attached the sample project here: ChartUpdate.zip

    If you’re still seeing issues, you can try calling the FlexChart1.Refresh() method after updating the data. Otherwise, please modify the attached sample to help us reproduce the issue, and we’ll be happy to look into it further.

    Thanks & regards,

    Aastha

  • Posted 17 July 2025, 10:53 am EST

    Thanks, yes, it works well with timers, but I have a MQTT source adding values.

    If one of the values is single.NaN (receiving nothing) then the flexChart1 hangs.

    One more point: I have a rangeselector added, but the _rsXRangeSelector values don’t match the flexchart1 axisx settings.

    Code is from your example:

    Public Class Form1
        Private _dataItems As New BindingList(Of DataItem)
        Private _lastSaved_dataItem As New DataItem
        Private _rsXRangeSelector As RangeSelector
        Private Sub Form1_Load(sender As Object, e As EventArgs) Handles MyBase.Load
            SetupChart()
            Timer1.Start()
        End Sub
    
        ''' <summary>
        ''' Method for initializing FlexChart
        ''' </summary
        Protected Sub SetupChart()
    
            _dataItems.Add(New DataItem With {
                           .dt = Now,
                           .istHum = Single.NaN,
                           .istTemp = 0,
                           .sollHum = Single.NaN,
                           .sollTemp = 0,
                           .OnOff = 0,
                           .RunPause = 0})
    
            FlexChart1.Series.Clear()
    
            FlexChart1.ChartType = C1.Chart.ChartType.Line
    
            'Setting FlexChart's Header 
            Me.FlexChart1.Header.Content = "Daily Price Movement"
    
            'Passing data in FlexChart
            Me.FlexChart1.DataSource = _dataItems
    
            'Binding chart's AxisX to 'Date' so dates appear in Horizontal axis
            Me.FlexChart1.BindingX = "dt"
    
            'Binding FlexChart to 'Volume' so their market share appears in Vertical axis
            FlexChart1.Series.Add(New Series() With {.Name = "Temperatur", .Binding = "istTemp", .ChartType = ChartType.Scatter, .SymbolSize = 10})
            FlexChart1.Series.Add(New Series() With {.Name = "Humidity", .Binding = "istHum", .ChartType = ChartType.Scatter, .SymbolSize = 7})
            FlexChart1.Series.Add(New Series() With {.Name = "SollTemp", .Binding = "sollTemp"})
            FlexChart1.Series.Add(New Series() With {.Name = "SollHum", .Binding = "sollHum"})
    
            'Positioning legend's at Top since as there axes at both left, right of FlexChart
            Me.FlexChart1.Legend.Position = Position.Top
    
            '#Region "setuprangeselector"
    
            'Setup Range Selector Chart
    
            'Setting ChartType for RangeSelection chart
            _fcChartRangeSelector.ChartType = ChartType.Line
    
            'Passing data in RangeSelection chart
            _fcChartRangeSelector.DataSource = Me.FlexChart1.DataSource
    
            'Binding chart's AxisX to 'Date' so dates appear in Horizontal axis
            _fcChartRangeSelector.BindingX = "dt"
    
            'Adding a new Series for High quote, hence binding it to "High" field 
            _fcChartRangeSelector.Series.Add(New Series() With {
                 .Binding = "istTemp"
            })
    
            AddHandler _fcChartRangeSelector.Rendered, Sub(s, e)
                                                           SetupRangeSelector()
                                                           Debug.Print($"rangeSel  :   {DateTime.FromOADate(_rsXRangeSelector.LowerValue)},  {DateTime.FromOADate(_rsXRangeSelector.UpperValue)}")
                                                       End Sub
        End Sub
    
        Private Sub SetupRangeSelector()
            If _rsXRangeSelector IsNot Nothing Then
                Return
            End If
            _rsXRangeSelector = New C1.Win.Chart.Interaction.RangeSelector(_fcChartRangeSelector)
    
            'Handle event so axis values change as range selection changes
            AddHandler _rsXRangeSelector.ValueChanged, Function(s, e)
                                                           flexChart1.AxisX.Min = _rsXRangeSelector.LowerValue
                                                           flexChart1.AxisX.Max = _rsXRangeSelector.UpperValue
    
                                                       End Function
            _rsXRangeSelector.LowerValue = _rsXRangeSelector.UpperValue - 90
        End Sub
    
        Private Sub Timer1_Tick(sender As Object, e As EventArgs) Handles Timer1.Tick
            Dim rand As New Random
    
            _lastSaved_dataItem.OnOff = 0
            _lastSaved_dataItem.RunPause = 0
            _lastSaved_dataItem.istTemp = rand.Next(10, 30)
            _lastSaved_dataItem.sollTemp = rand.Next(20, 25)
            _lastSaved_dataItem.istHum = rand.Next(15, 90)
            _lastSaved_dataItem.sollHum = rand.Next(20, 80)
            _lastSaved_dataItem.dt = Now
    
            _dataItems.Add(_lastSaved_dataItem)
    
            _lastSaved_dataItem = New DataItem
        End Sub
    End Class

    Maybe it’s a country/language setting, the selector does’nt see the underlying datetime format in a correct way. Min and Max values are half a day away.

    One more suggestion is a preview of the post, before posting and why does

    some code
    does not render correctly (see above)?

    Regards

    Chris

  • Posted 18 July 2025, 7:02 am EST - Updated 18 July 2025, 7:07 am EST

    Hi Chris,

    Thanks for sharing the details.

    We updated your sample as per your latest inputs, but we were still not able to reproduce the issue on our side. Please check the attached GIF to see how it behaves for us:

    We’ve also attached the updated sample project here for your reference: ChartUpdate_Mod.zip

    > Maybe it’s a country/language setting, the selector does’nt see the underlying datetime format in a correct way.

    Could you let us know if you’re setting a different culture in your application, or if your system region/language settings are different? That might help us replicate the problem more accurately.

    > One more suggestion is a preview of the post, before posting

    Thank you for your feedback. We will share it with the concerned team.

    Kind Regards,

    Aastha

  • Posted 21 July 2025, 2:54 am EST

    Hi Aastha,

    thanks for the reply, but your rangeselector doesn’t select anything. In my opinion the rangeselector should zoom into a part of the whole range.

    Regards

    Chris

  • Posted 21 July 2025, 4:59 am EST

    With my modification there is a change in flexchart1 Axis, but not as intended:

    while dragging the thumbs, you can see the range limits are far away from the position on the _fcChartRangeSelector axis.

    Imports System.ComponentModel
    Imports C1.Chart
    Imports C1.Win.Chart
    Imports C1.Win.Chart.Interaction
    
    Public Class Form1
    
        Private _dataItems As New BindingList(Of DataItem)()
        Private _lastSaved_dataItem As New DataItem()
        Private WithEvents _rsXRangeSelector As RangeSelector
    
        Private Sub Form1_Load(sender As Object, e As EventArgs) Handles MyBase.Load
            SetupChart()
            Timer2.Interval = 1000
            Timer2.Start()
        End Sub
    
        Private Sub SetupChart()
            ' Add initial dummy data
            _dataItems.Add(New DataItem With {
                .dt = Now,
                .istHum = Single.NaN,
                .istTemp = 0,
                .sollHum = Single.NaN,
                .sollTemp = 0,
                .OnOff = 0,
                .RunPause = 0
            })
    
            FlexChart1.Series.Clear()
            FlexChart1.ChartType = ChartType.Line
            FlexChart1.Header.Content = "Daily Sensor Readings"
            FlexChart1.DataSource = _dataItems
            FlexChart1.BindingX = "dt"
            FlexChart1.Legend.Position = Position.Top
    
            FlexChart1.Series.Add(New Series() With {
                .Name = "Temperatur",
                .Binding = "istTemp",
                .ChartType = ChartType.Scatter,
                .SymbolSize = 10
            })
    
            FlexChart1.Series.Add(New Series() With {
                .Name = "Humidity",
                .Binding = "istHum",
                .ChartType = ChartType.Scatter,
                .SymbolSize = 7
            })
    
            FlexChart1.Series.Add(New Series() With {
                .Name = "SollTemp",
                .Binding = "sollTemp"
            })
    
            FlexChart1.Series.Add(New Series() With {
                .Name = "SollHum",
                .Binding = "sollHum"
            })
    
            ' Set up range selector chart
            _fcChartRangeSelector.ChartType = ChartType.Line
            _fcChartRangeSelector.DataSource = _dataItems
            _fcChartRangeSelector.BindingX = "dt"
            _fcChartRangeSelector.Series.Clear()
            _fcChartRangeSelector.Series.Add(New Series() With {
                .Binding = "istTemp"
            })
    
    
        End Sub
    
    
        Private Sub Timer1_Tick(sender As Object, e As EventArgs) Handles Timer2.Tick
            Dim rand As New Random()
    
            ' Randomly decide whether to insert NaN (25% chance for each field)
            Dim item As New DataItem With {
            .dt = Now,
            .istTemp = If(rand.Next(0, 4) = 0, Single.NaN, rand.Next(10, 30)),
            .sollTemp = If(rand.Next(0, 4) = 0, Single.NaN, rand.Next(20, 25)),
            .istHum = If(rand.Next(0, 4) = 0, Single.NaN, rand.Next(15, 90)),
            .sollHum = If(rand.Next(0, 4) = 0, Single.NaN, rand.Next(20, 80)),
            .OnOff = 0,
            .RunPause = 0
        }
    
            _dataItems.Add(item)
    
            ' Optional: Scroll X-axis automatically
            FlexChart1.AxisX.Min = _rsXRangeSelector?.LowerValue
            FlexChart1.AxisX.Max = _rsXRangeSelector?.UpperValue
        End Sub
    
        Private Sub _rsXRangeSelector_ValueChanged(sender As Object, e As EventArgs) Handles _rsXRangeSelector.ValueChanged
            FlexChart1.AxisX.Min = _rsXRangeSelector.LowerValue
            FlexChart1.AxisX.Max = _rsXRangeSelector.UpperValue
            Debug.Print($"rangeSel  :   {DateTime.FromOADate(_rsXRangeSelector.LowerValue)},  {DateTime.FromOADate(_rsXRangeSelector.UpperValue)}")
        End Sub
    
        Private Sub _fcChartRangeSelector_Rendered(sender As Object, e As RenderEventArgs) Handles _fcChartRangeSelector.Rendered
            If _rsXRangeSelector IsNot Nothing Then
                Return
            End If
            _rsXRangeSelector = New RangeSelector(_fcChartRangeSelector)
    
            _rsXRangeSelector.LowerValue = _fcChartRangeSelector.AxisX.ActualMin
            _rsXRangeSelector.UpperValue = _fcChartRangeSelector.AxisX.ActualMax
        End Sub
    End Class
    
    Public Class DataItem
        Public Property dt As DateTime
        Public Property istTemp As Single
        Public Property sollTemp As Single
        Public Property istHum As Single
        Public Property sollHum As Single
        Public Property OnOff As Integer
        Public Property RunPause As Integer
    End Class
    
  • Posted 21 July 2025, 11:46 am EST

    Hi Chris,

    Thanks for sharing the updated code snippet.

    We are currently investigating this issue.

    Kind Regards,

    Aastha

  • Posted 22 July 2025, 5:58 am EST

    Hi Chris,

    Thanks for your patience.

    We are currently discussing this issue with our developers. [Internal Tracking ID: C1WIN-34333] We will update you on this as soon as we hear back from them.

    Kind Regards,

    Aastha

  • Posted 23 July 2025, 3:19 am EST

    Hi Chris,

    As per the developers, RangeSelector is generally intended to work with static data but with some tuning it should also work with dynamic data. The sample had some problems with implementation (e.g. selector is create multiple times when chart redraws). They have fixed them and made small changes (like, updating selector min/max when adding new data item) to work it correctly.

    Kindly refer to the attached sample for full implementation. ChartUpdate-250722.zip

    Thanks & regards,

    Aastha

  • Posted 23 July 2025, 10:56 am EST

    Hi Aastha,

    after running ChartUpdate-250722:

    good: the rangeselector shows the selected range in flexchart1

    bad:

            _rsXRangeSelector.Minimum = _dataItems(0).dt.ToOADate
            _rsXRangeSelector.Maximum = item.dt.ToOADate

    has the new values but does not react: the AddHandler _rsXRangeSelector.ValueChanged, Sub(s, e) … is not triggered and the range moves within the lower chart to the left.

    Regards,

    Chris

  • Posted 23 July 2025, 11:02 am EST

    Sorry I confused .Maximum and .UpperValue. Adding this to the code is exactly what I wanted to have.

    Thanks for the help.

    Regards,

    Chris

Need extra support?

Upgrade your support plan and get personal unlimited phone support with our customer engagement team

Learn More

Forum Channels