
Posted 22 August 2022, 6:50 am EST - Updated 3 October 2022, 10:15 pm EST
If anyone can help that would be great trying to create box whisker plot and I’ve followed sample code but I think I am missing something. Here is my code:
```
boxPlot.BeginUpdate();
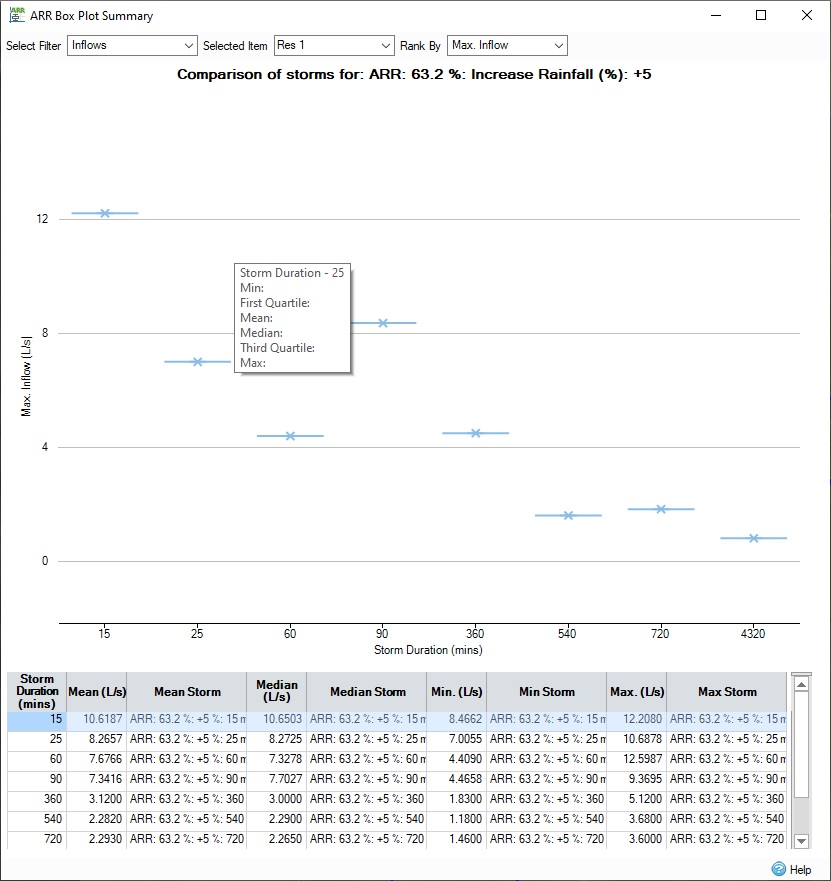
            //get data from handler
            List<DurationValue> data = handler.GetGraphData();

            boxPlot.Series.Clear();

            boxPlot.ChartType = C1.Chart.ChartType.Column;
            boxPlot.DataSource = data;
            boxPlot.BindingX = "Duration";
            boxPlot.ToolTip.Content = "{seriesName} - {name}\nMin: {Min}\nFirst Quartile: {FirstQuartile}\nMean: {Mean}\nMedian: {Median}\nThird Quartile: {ThirdQuartile}\nMax: {Max}";

            boxPlot.Legend.Position = C1.Chart.Position.None;
            boxPlot.AxisX.MajorGrid = false;

            boxPlot.AxisY.Title = "";

            Series series = new BoxWhisker()
            {
                Name = "Storm Duration",
                Binding = "Value",
                QuartileCalculation = C1.Chart.QuartileCalculation.InclusiveMedian
            };
            boxPlot.Series.Add(series);

            boxPlot.EndUpdate();
public class DurationValue
{
    public string Duration { get; set; }
    public double Value { get; set; }
}


