Posted 2 October 2020, 6:42 am EST
Good day,
In the attached project i am doing a chart where i have to show a Trendline.
If you can support in this issue, that will be great. I have joined a jpg that Shows what i mean.
Best regards
Said
Forums Home / ComponentOne / WinForms Edition
Posted by: saidnai on 2 October 2020, 6:42 am EST

saidnai
Posted 2 October 2020, 6:42 am EST
Good day,
In the attached project i am doing a chart where i have to show a Trendline.
If you can support in this issue, that will be great. I have joined a jpg that Shows what i mean.
Best regards
Said

basant.khatiyan
![]()
Posted 5 October 2020, 2:22 am EST
Hi Said,
It seems like your sample and image couldn’t be attached properly. Please reattach them if you have any specific requirement.
However, you can refer to the documentation for details about TrendLines in C1Chart from ‘https://www.grapecity.com/componentone/docs/win/online-chart2d/workingwithtrendline.html’.
Also, I would like to inform you that C1Chart is in maintenance now and FlexChart is our new & more efficient charting control. So, you might want to use FlexChart instead of C1Chart. For TrendLines in FlexChart, you may refer to ‘https://www.grapecity.com/componentone/docs/win/online-flexchart/trendline.html’.
Regards,
Basant
saidnai
Posted 5 October 2020, 5:10 am EST - Updated 3 October 2022, 11:36 pm EST
Dear Basant,
Thank for the note About Flexchart. For a while i have asked support for creating 3 Charts in one report. One of your colleague gave me one sample that i adjusted as i need and it is working fine.
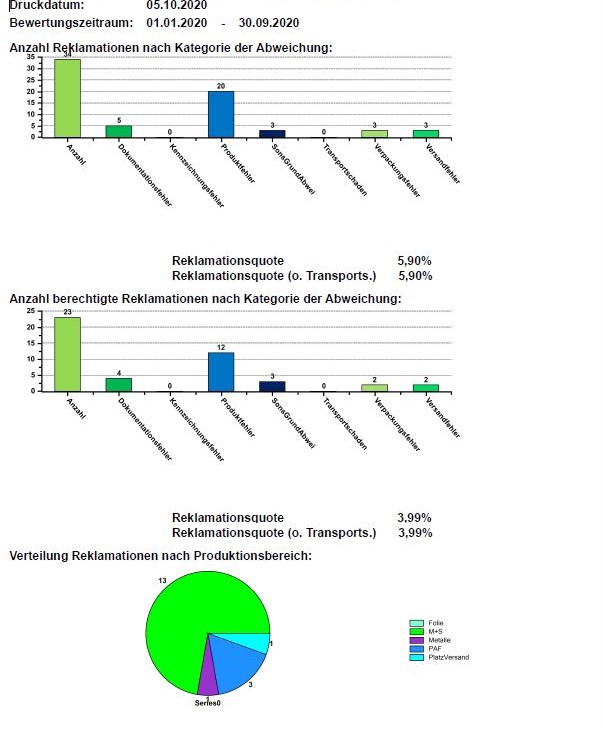
Likely i am at the beginnen and i need to do more statistiks and evaluations. I’d like to move to Flexchart now. Can you provid me a detail VB sample that i can use and learn from it. See attached Chart sample that i do now with C1Chart.
Best regards
Na
basant.khatiyan
![]()
Posted 6 October 2020, 3:09 am EST - Updated 3 October 2022, 11:37 pm EST
Hi Said,
Thank you for informing that you are using charts in FlexReport. However, charts in reports have limited functionalities as compared to charts as standalone control. TrendLines are not supported in both C1Chart/FlexChart fields of FlexReport.
However, if needed, as a workaround you can create a FlexChart with TrendLine separately and save it as image. And then you can add the FlexChart image as an ImageField in FlexReport.
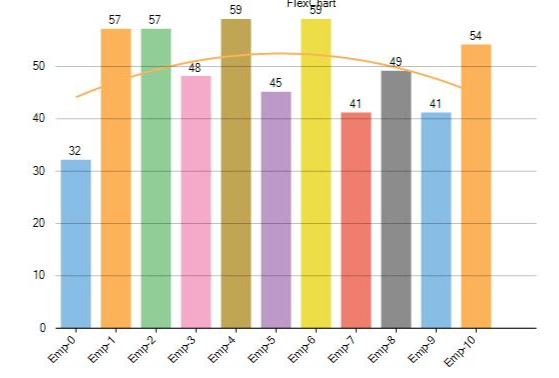
Please refer to the attached sample for the same. Also, to explore support for charts in FlexReport, you may refer to the ‘Controls’ section of ‘FlexReportExplorer’ product sample (location: Documents\ComponentOne Samples\WinForms\v4.5.2\C1FlexReport\CS\FlexReportExplorer)
Regards,
Basant
saidnai
Posted 6 October 2020, 4:36 am EST
Dear Basant,
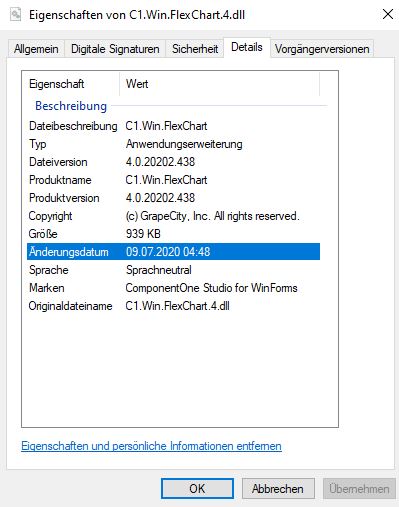
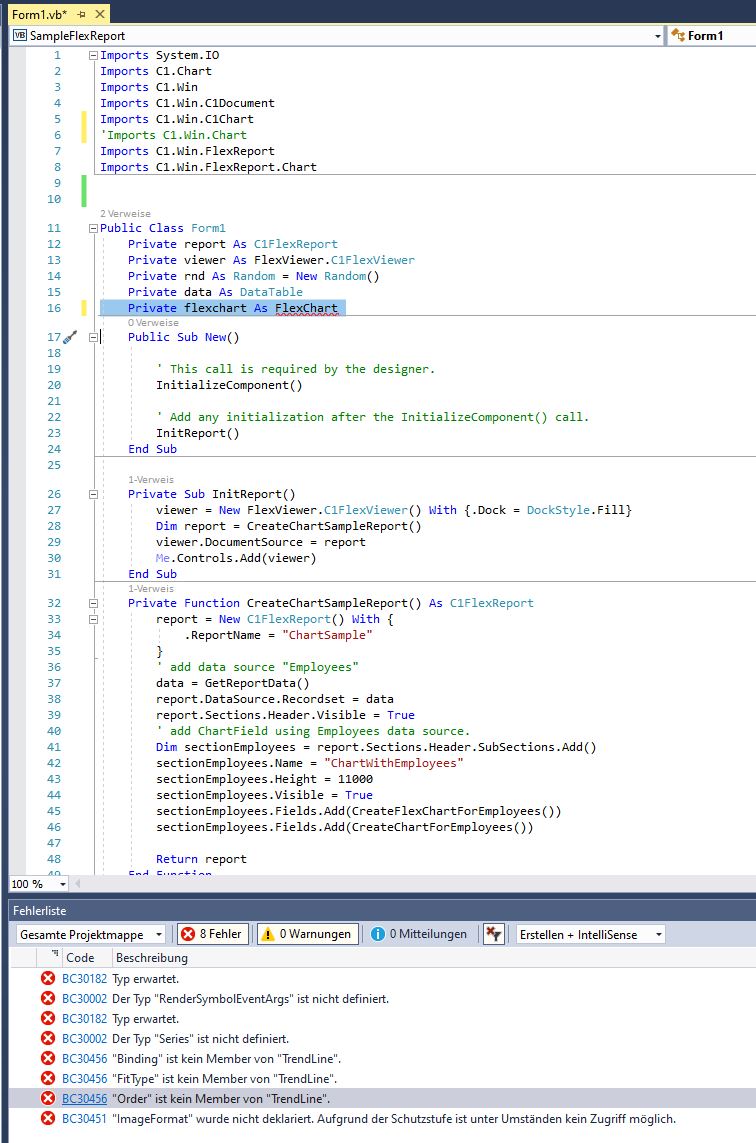
It seems that your sample is done with the C1 Version 4.5.2. After running the update on my side. i only can get 4.0.2. In the sample, I have updated all the compnent to 4.0.2 but it leeds to the following Problems:
This line is not rocognized:
Private flexchart As FlexChart
and others like series etc. see pictures attached.
Best regards
Said
saidnai
Posted 6 October 2020, 8:06 am EST
Dear Basant,
Here some other Information to show you what i have to do. All my data are comming from the SQL-Database. I use VB.net 2017 actually, C1 Version you can see above. The target is to create Charts, different typ (Pie, Column, etc…) with trendline and without for our Management. It should be printable. Your solution is not bad. A running sample can support me lot.
Thanks & Best regards
Said
basant.khatiyan
![]()
Posted 7 October 2020, 2:26 am EST
Hi Said,
Thanks for the snapshots. I have updated the sample for using 4.0 version dlls. Also, I see in the screenshot that you have commented the following import and hence the FlexChart not recognized issue as it’s defined in that namespace only.
Import C1.Win.Chart
Please verify the attached updated sample and let us know if you still face any issues.
Regards,
Basant
SampleFlexReport_4.0.zip
saidnai
Posted 7 October 2020, 11:18 am EST
Dear Basant,
Thanks for support. Unlikely i cannot bind the dataset to the Flexchart. Can you review your sample and send it again to me. I have joind an MSAccess DB for it. The connetion and query are like follow:
Private Function CreateFlexChartForEmployees() As ImageField
    'flexchart = New FlexChart() With {.Width = 600, .Height = 400, .DataSource = data.DefaultView, .BindingX = "Name", .Binding = "Age", .ChartType = ChartType.Column, .BackColor = Color.White}

    flexchart = New FlexChart() With {.Width = 600, .Height = 400, .BindingX = "TxTJJJJMM", .Binding = "AVGValue", .ChartType = ChartType.Column, .BackColor = Color.White}

    ' add data source
    Dim SqlStr = "SELECT TxTJJJJMM, AVGValue FROM Tmp_HG_AV_Bewertung Where TreueTyp = 'L' AND JJJJMM >= '202001' AND JJJJMM <= '202009' AND Erstelltvon = 'Nai' ORDER BY JJJJMM"
    Dim ds = New DataSource() With
        {
        .Name = "TmpBewertungHG1",
        .ConnectionString = "Driver={Microsoft Access Driver (*.mdb)};Dbq=C:\Temp\Sample20201007\Sample20201007\FlexrptDB.mdb;Uid=Admin;Pwd=;",
        .RecordSource = SqlStr
        }
    flexchart.DataSource = ds

    flexchart.Header.Content = "FlexChart"

    Dim ser = New Series() With {.Name = "Age"}
    flexchart.DataLabel.Position = LabelPosition.Top
    flexchart.DataLabel.Content = "{y}"
    flexchart.Series.Add(ser)
    flexchart.Series.Add(New TrendLine() With {.Binding = "Age", .FitType = FitType.Polynom, .Order = 2})
    flexchart.AxisX.Min = -0.5
    flexchart.AxisX.Max = data.Rows.Count + 0.5
    flexchart.AxisX.LabelAngle = 45

    AddHandler ser.SymbolRendering, AddressOf SymbolRendering

    Me.Controls.Add(flexchart) ' Add temporarily for proper rendering while exporting/saving
    Using ms = File.Create("flexchart.jpg")
        flexchart.SaveImage(ms, ImageFormat.Jpg, flexchart.Width, flexchart.Height)
    End Using

    Dim img = New ImageField() With {.Width = 8000, .AutoHeight = AutoSizeBehavior.CanGrow, .Top = 5100, .Left = 100}
    img.Picture = Image.FromFile("flexchart.jpg")
    Me.Controls.Remove(flexchart)
    Return img
End Function
Best regards
Said
basant.khatiyan
![]()
Posted 8 October 2020, 2:29 am EST
Hi Said,
The DataSource (i.e. C1.Win.FlexReport.DataSource) is not a collection type and is used explicitly by FlexReport. Whereas, FlexChart expects collection of objects whose property values can be displayed as data items on chart. So, instead of DataSource, you have to provide a collection of items (e.g. DataView in the previous example) as DataSource for FlexChart. (Refer https://www.grapecity.com/componentone/docs/win/online-flexchart/C1.Win.FlexChart.4.5.2~C1.Win.Chart.FlexChart~DataSource.html)
Therefore, you can instead populate data from DB into a DataTable and set FlexChart.DataSource as follows:
' add data source
Dim conn = New OleDb.OleDbConnection("Provider=Microsoft.ACE.OLEDB.12.0;Data Source=C:\Temp\Sample20201007\Sample20201007\FlexrptDB.mdb;")
Dim cmd = New OleDb.OleDbCommand("SELECT TxTJJJJMM, AVGValue FROM Tmp_HG_AV_Bewertung Where TreueTyp = 'L' AND [b]JJJJMM >= 202001[/b] AND J[b]JJJMM <= 202009[/b] AND Erstelltvon = 'Nai' ORDER BY JJJJMM", conn)
Dim adapter = New OleDb.OleDbDataAdapter(cmd)
Dim ds As DataTable = New DataTable()
adapter.Fill(ds)
[b]flexchart.DataSource = ds.DefaultView[/b]
Also, there was a type mismatch in your select query for JJJJMM (expected integer but found string). Hope the above explanation helps.
Regards,
Basant