FlexChart AxisX name instead of number

Posted by: saidnai on 14 July 2023, 11:23 am EST

  • Posted 14 July 2023, 11:23 am EST - Updated 14 July 2023, 11:29 am EST

    Hello,

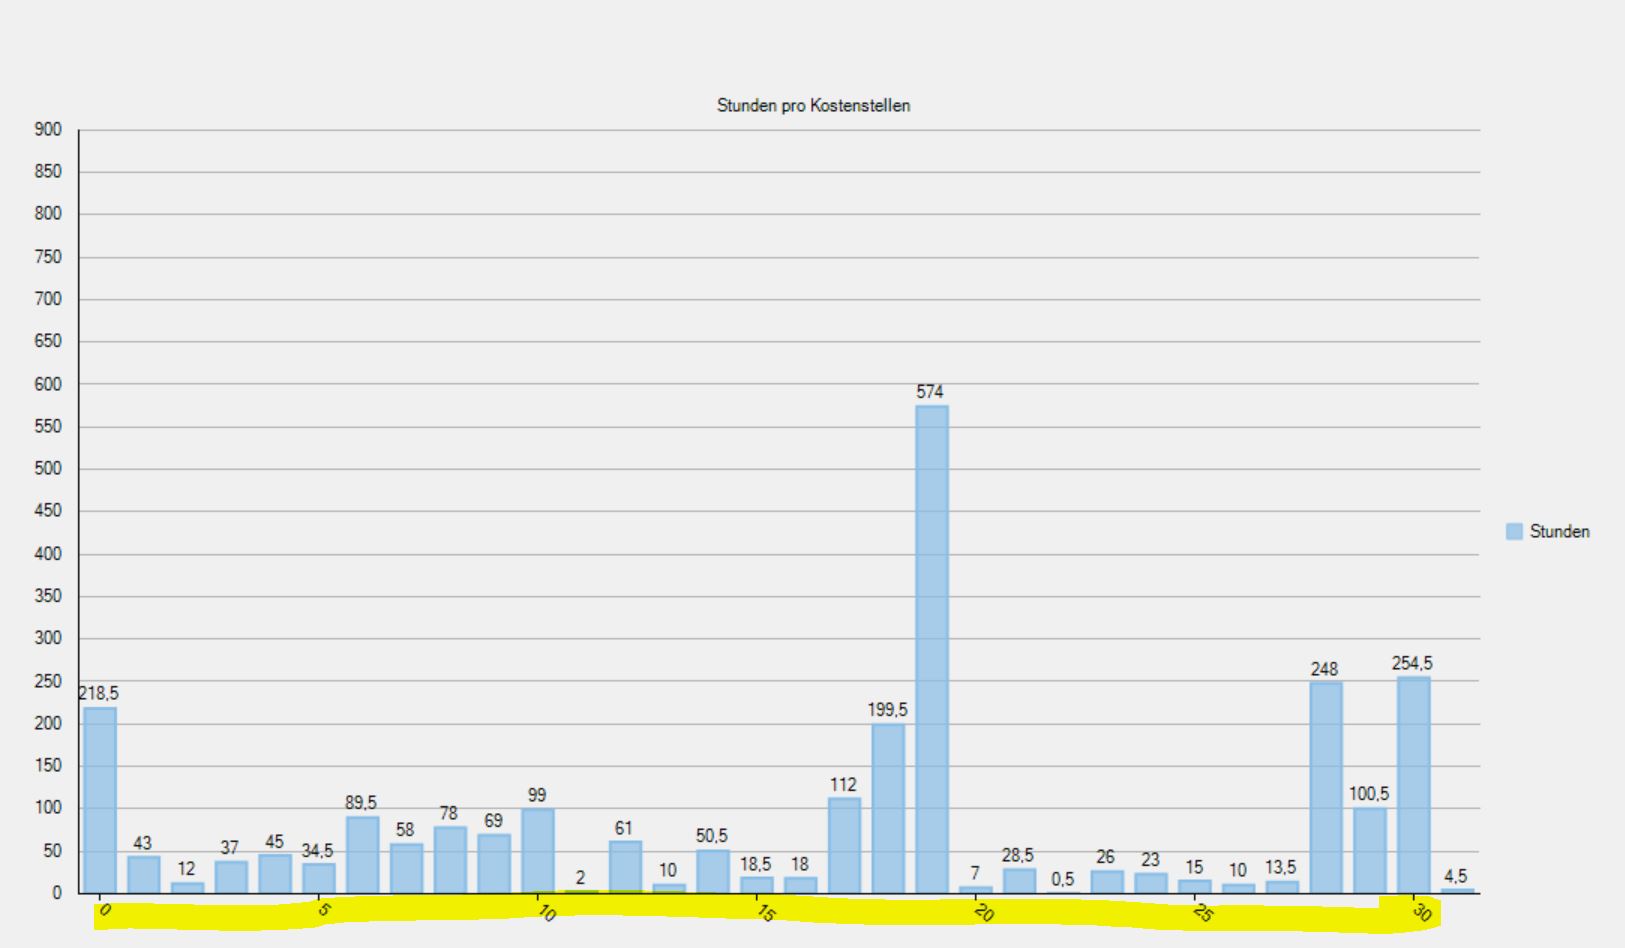
    I met a small problem, when i use an existing code sample. The problem is, i do not get the text shon for the AxisX, here is the code and the picture:

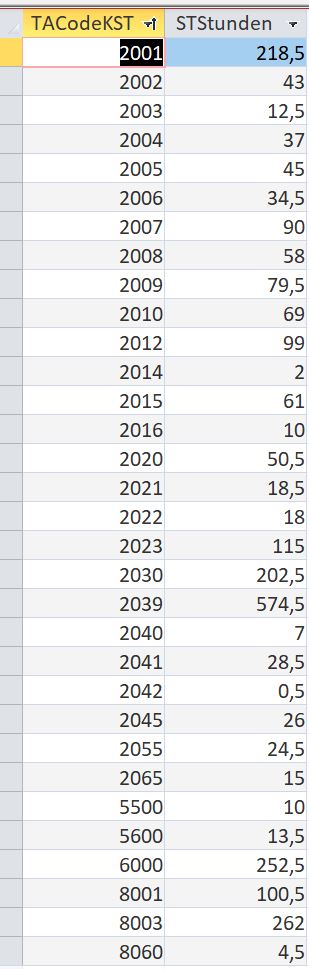
        Dim ds As New DataSet
        Dim dt As New DataTable
        Dim da As Odbc.OdbcDataAdapter
        Dim SqlStr As String = "SELECT QRY_TA_Stunden_Pro_Kostenstelle.TACodeKST, Sum(QRY_TA_Stunden_Pro_Kostenstelle.TStunden) AS STStunden FROM QRY_TA_Stunden_Pro_Kostenstelle " &
                               "Where Year(QRY_TA_Stunden_Pro_Kostenstelle.SKJahr) = '" & 2023 & "' " &
                               "GROUP BY QRY_TA_Stunden_Pro_Kostenstelle.TACodeKST " &
                               "ORDER BY QRY_TA_Stunden_Pro_Kostenstelle.TACodeKST"
        da = New Odbc.OdbcDataAdapter(SqlStr, connectionString1)
        da.Fill(dt)
        FlexChart1.DataSource = dt
        FlexChart1.BeginUpdate()
        FlexChart1.ChartType = C1.Chart.ChartType.Column
        FlexChart1.Series.Clear()
        FlexChart1.Series.Add(New Series() With {.Name = "Stunden", .Binding = "STStunden"})
    
        'AxisX
        FlexChart1.AxisX.Labels.Equals("{TACodeKST}")
        FlexChart1.AxisX.Labels = True
        FlexChart1.AxisX.LabelAngle = -40
    
        'Daten für die AxisX Säule
        FlexChart1.DataLabel.Content = "{STStunden}"
        FlexChart1.DataLabel.Position = C1.Chart.LabelPosition.Top
    
        'AxisY
        FlexChart1.AxisY.MajorUnit = 50
        FlexChart1.AxisY.Min = 0
        FlexChart1.AxisY.Max = 900
    
        'Specify titles for FlexChart header and axes
        FlexChart1.Header.Content = "Stunden pro Kostenstellen"
        FlexChart1.EndUpdate()
    

    I guess for the expert is easier to get it.

    Best regards & Thanks

    Said

  • Posted 17 July 2023, 6:37 am EST

    Hi Said,

    The above reply seems to be a spam. I will remove the above reply(SPAM) and your reply to that. Hope that is fine with you?

    Now regarding your query, we would like to suggest you bind the x-axis to a collection of number-name type data for mapping the labels. Please refer to the following code for the same:

    // Setting data-source of x-axis
    FlexChart1.AxisX.DataSource = GetAxisXSource();
    FlexChart1.AxisX.Binding = "Value,Code";

    // method to map the names with number
    public List<DataPointAxisX> GetAxisXSource()
    {
        List<DataPointAxisX> dtPoints = new List<DataPointAxisX>();
        string[] codes = { "A", "B", "C", "D", "E", "F", "G" }; 
        for (int i = 0, c=0; i<=30; i=i+5, c++)
        {
            DataPointAxisX dp = new DataPointAxisX() { Value = i, Code = codes[c] };
            dtPoints.Add(dp);
        }
        return dtPoints;
    }

    Kindly refer to the attached sample for full implementation. See AxisXNameInsteadOfNumber.zip

    You can refer to the following link for information related to Axis Binding: https://www.grapecity.com/componentone/docs/win/online-flexchart/binding.html#axisbinding

    Please let us know if you need any further help regarding this.

    Thanks & Regards,

    Aastha

  • Posted 17 July 2023, 8:10 am EST - Updated 17 July 2023, 8:15 am EST

    Hi Said,

    PFA the VB project for reference. AxisXNameInsteadOfNumber_VB.zip

    You can refer to the VB.NET code for the GetAxisXSource method below:

    'Setting data-source of x-axis
    FlexChart1.AxisX.DataSource = GetAxisXSource()
    FlexChart1.AxisX.Binding = "Value,Code"

    'method to map the names with number
    Public Function GetAxisXSource() As List(Of DataPointAxisX)
        Dim dtPoints As List(Of DataPointAxisX) = New List(Of DataPointAxisX)()
        Dim codes = {"A", "B", "C", "D", "E", "F", "G"}
        Dim i = 0, c = 0
        While i <= 30
            Dim dp As DataPointAxisX = New DataPointAxisX() With {
                .Value = i,
                .Code = codes(c)
            }
            dtPoints.Add(dp)
            i = i + 5
            c += 1
        End While
        Return dtPoints
    End Function

    Best Regards,

    Aastha

  • Posted 17 July 2023, 9:43 am EST

    Dear Aastha,

    Thanks for your reply. All good. I was only surprise with the SPAM answer. Please delete also my answer to it.

    So regarding the. All my data are coming from the database. AS you can see in the SQL-String on Top, the field name “QRY_TA_Stunden_Pro_Kostenstelle.TACodeKST” has to be shown. It is a numeric field showing the cost center. The Value is the oder field " STStunden" is the sum of the wrok hours. All the sample codes are based of manual lists (A,B,C,…) but i need this coming from the database means the cost center. The are too many i cannot manage them manually.

    By the way the link, i have already seen it and also fetch in the Flexchart.PDF but i cannot find samples with data from the database.

    Thanks & Best regards

    Said

  • Posted 17 July 2023, 11:33 am EST - Updated 17 July 2023, 11:38 am EST

    Dear Aastha,

    each column is a different cost center.

    Thanks & Best regards

    Said

  • Posted 18 July 2023, 7:59 am EST

    Hi Said,

    Thanks for your confirmation. We have removed the spam message along with your reply.

    Now about the query, we would suggest you create a list of data objects from the DataTable, that is being created from the database. Setting binding to an axis only works when a collection is set as its datasource.

    You have also mentioned that “TACodeKST” is a numeric type of field. For mapping a value for an axis, Axis’ Binding property requires the resultant value to be of string type. Hence, our data object contains values from “TACodeKST” column as string type. Please refer to the following code:

        Public Function ConvertDataTableToList(ByVal dataTable As DataTable) As List(Of MyObject)
             Dim myList As List(Of MyObject) = New List(Of MyObject)()
             For Each row As DataRow In dataTable.Rows
                 Dim obj As MyObject = New MyObject()
                 ' Assuming the column names in the DataTable match the property names in the MyObject class
                 obj.Ob_Hours = Convert.ToInt32(row("Hours"))
                 obj.Ob_HPCC = Convert.ToDouble(row("Hours_per_cost_center"))
                 obj.Ob_Code = row("TACodeKST").ToString() ' string type property need to be bound as custom label to the axis
                 myList.Add(obj)
             Next
             Return myList
         End Function
     End Class

    We have attached the updated sample application for your reference. Please check AxisXNameInsteadOfNumber_Mod1.zip

    Kindly let us know if you need any further help.

    Thanks & Regards,

    Aastha

  • Posted 18 July 2023, 9:43 am EST - Updated 18 July 2023, 9:48 am EST

    Hi Aastha,

    I have done the same with the sample you send to me before. I got the expected result. Thanks for the that.

    I still have some questions regarding the Flexcahrt and the AxisX:

    1. I will also need to show more AxisX. I think as i understand i should

      duplicate the function with a news serie right?

    *Post Cost

    *Hours per Workers

    The picture attached is from the old tool that we want o get rid of.    
    
    1. I also need to print the Flexcahrt result. As i found i should be saved as a picture and than printed. Can you please forward a sample VB how to print it.

    I really appreciate the support of all the team.

    Best regards

    Said

  • Posted 19 July 2023, 8:56 am EST

    Hi Said,

    > 1. I will also need to show more AxisX.

    As per our understanding you want to show multiple series data in your chart. If that is the case, you have thought of the right approach. You will need to add new series to the flexchart control. The following code will add two series to the flexchart control. You can add more as per your requirement:

    FlexChart1.Series.Add(New Series With {
                    .Name = "Stunden",
                    .Binding = "Hours_per_cost_center",
                    .BindingX = "Hours"
                })
                FlexChart1.Series.Add(New Series With {
                    .Name = "Ser2",
                    .Binding = "New_Series",
                    .BindingX = "Hours"
                })

    >2. I also need to print the Flexcahrt result.

    You can refer to the following documentation link to learn about printing the flexchart control: *https://www.grapecity.com/componentone/docs/win/online-flexchart/print.html

    If you want to export the flexchart to image format, you can follow this link: *https://www.grapecity.com/componentone/docs/win/online-flexchart/export.html

    These links contain both VB and C# code for the implementation.

    We have also attached the sample application for demonstrating the implementation of both the requirements. Please follow the steps below to run the application:

    1. Unzip the folder. [AxisXNameInsteadOfNumber.zip]

    2. Open the Solution file.

    3. Right click on the references option of the Project in the solution explorer window.

    4. Click on ‘Add References’. Add the DLL from the attached zip file. [PrintingDLL.zip]

    5. Run the application.

    Hope this helps.

    Thanks & Regards,

    Aastha

  • Posted 21 July 2023, 6:30 am EST

    Dear Aastha,

    First issue that was mein meaning. I will practice it and give you a feedback

    Second issue i have add the DLL and could see the preview before printing

    :slight_smile:

    Thanks & Best regards

    Said

  • Posted 22 July 2023, 6:39 am EST

    Dear Aastha,

    I will really appreciate it. If can have a VB sample code for FlexChart taking data form the database. So can the Series be extanded and bind directly according to the dataset.

    Thanks & Best regards

    Said

  • Posted 25 July 2023, 2:47 am EST

    Hi Said,

    We have created a sample for you where the data for the flexchart is fetched from a database. Please refer AxisXNameInsteadOfNumber.zip.

    We have attached the DB file and the C1.Chart.FlexChart.Printing.dll with the project. Please add the reference to the DLL with the steps we already provided. As per the project code, we recommend you add the database file Documents folder (Special System Folder) of your user profile in the system: C:\Users<User-name>\Documents.

    >So can the Series be extanded and bind directly according to the dataset.

    Since, you want the mapping of the x-axis labels, you will need to create an object that contains the string version of the double type of field. In your scenario, data from the ‘TACodeKST’ need to be converted to string for the axis mapping purpose.

    Please let us know if you need any further help regarding this.

    Thanks & Regards,

    Aastha

  • Posted 25 July 2023, 8:00 am EST

    Dear Aastha,

    Thank you, but in the hole project i cannot find the database name “CostHoursDB.mdb” or the tabel “HoursData”. Maybe you linked the wrong project.

    Best regards

    Said

  • Posted 26 July 2023, 8:01 am EST

    Hi Said,

    We are not sure why you could not find the mdb file. We have verified that we have attached the correct sample. Please see DBFile.zip.

    However, we are again attaching the sample for your reference. Check Application_DB.zip

    Please follow the steps suggested in the previous response to run the application.

    Thanks & Regards,

    Aastha

  • Posted 26 July 2023, 8:32 am EST

    Dear Aastha,

    The database name “CostHoursDB.mdb” was attached. no problem. What i mean is, i search the hole application code to see where the database is bind to the Flexchart.

    But no SQL string or dataset is in.

    Sorry for the missunderstand.

    Best regards

    Said

  • Posted 27 July 2023, 6:36 am EST

    Hi Said,

    I apologize that I attached the wrong project earlier. I should have understood your concern in the earlier response only. Sorry for the inconvenience caused.

    I have attached the correct project now. Please refer AxisXNameInsteadOfNumber_ModDB.zip

    Please refer BindTable() method to check how we have connected the project to the database file.

    Thanks & Regards,

    Aastha

  • Posted 27 July 2023, 7:42 am EST

    Dear Aastha,

    Thank you.

    I will habe workaround the sample and give you a feedback.

    Best regards

    Said

  • Posted 4 August 2023, 11:07 am EST - Updated 4 August 2023, 11:12 am EST

    Dear Aastha,

    The sample with one serie from the DB i have adjusted to my need and is working fine.

    I need again your support.

    I tried to add other series over (for … next) depending on the worker number. Let say 4 workers see Tabelle1 in the Access DB attached.

    The target is to get a chart with number of hours for each worker according to the post code.

    In this case the chart should show in each post code the 4 workers with the number of the hours they worked for.

    Best regards

    Said

    (see attached old chart)

  • Posted 7 August 2023, 1:26 pm EST

    Hi Said,

    >I tried to add other series over (for … next) depending on the worker number. Let say 4 workers see Tabelle1 in the Access DB attached.

    It seems that you missed attaching the DB. However as per our understanding of your requirement, you want to plot a chart that shows number of hours spent by four different workers in different postal code. We have attached a sample considering this requirement. Please see AxisXNameInsteadOfNumber_Mod2.zip

    In case your requirement differs from our understanding please provide the updated database with some explanation about how you want it displayed.

    Thanks & Regards,

    Aastha

  • Posted 21 August 2023, 6:16 am EST

    Dear Aastha,

    I have tried the code is working fine with this logic. The result it exactly, what is expected. Only the logic to get it, it will be different.

    For the DB i am sorry. I have loaded the wrong file rar instead of zip. That is why it was not in.

    I have loaded now the right one. The content of the “Tabelle1” is the result that i get from the SQL-Query. If necessary i can work on it and use union.

    1) For the worker hours per period and per cost center the result can be “X” Worker.

    It is not fix. According to the “X” worker the series, Objects should be defined but

    not manually.

    2) the name of the workers must appear not the Field name.
    

    Best regards

    Said

    CostHoursDB.zip

  • Posted 22 August 2023, 9:09 am EST

    Hi Said,

    Thanks for providing the database file.

    The series in a flexchart are bound to the properties of the datasource. You can create a datatable that contains separate column for each worker with entries equal to their SumHours. You can further set this datatable as the datasource of the flexchart and create series accordingly.

    You can refer to the following code for the same:

    OleDbDataAdapter adapter = new OleDbDataAdapter(@"SELECT 
            Postcode,
            SUM(IIF(Worker = 'Albert', SumHOurs, 0)) AS Albert,
            SUM(IIF(Worker = 'Gomez', SumHOurs, 0)) AS Gomez,
            SUM(IIF(Worker = 'Robert', SumHOurs, 0)) AS Robert,
            SUM(IIF(Worker = 'Jim', SumHOurs, 0)) AS Jim
        FROM Tabelle1
        GROUP BY Postcode", conn);
    adapter.Fill(dt);
    flexChart1.DataSource = dt;
    flexChart1.Series.Clear();
    flexChart1.BindingX = "Postcode";
    flexChart1.Series.Add(new Series
    {
        //Name property specifies the string to be displayed corresponding to this Series in Legend
        Name = "Albert",
        Binding = "Albert"
    });
    flexChart1.Series.Add(new Series
    {
        //Name property specifies the string to be displayed corresponding to this Series in Legend
        Name = "Gomez",
        Binding = "Gomez"
    });
    flexChart1.Series.Add(new Series
    {
        //Name property specifies the string to be displayed corresponding to this Series in Legend
        Name = "Robert",
        Binding = "Robert"
    });
    flexChart1.Series.Add(new Series
    {
        //Name property specifies the string to be displayed corresponding to this Series in Legend
        Name = "Jim",
        Binding = "Jim"
    });
    flexChart1.AxisX.Title = "PostCode";
    flexChart1.AxisY.Title = "SumHours";

    You can refer to the attached sample for full implementation. ShowMultipleSeries.zip Update the file path of the MDB (database) file in the project as needed.

    Considering the length of this thread, kindly initiate a new case if you have any additional requirements so that we could manage them more efficiently.

    Thanks & Regards,

    Aastha

Need extra support?

Upgrade your support plan and get personal unlimited phone support with our customer engagement team

Learn More

Forum Channels