Posted 26 November 2021, 4:18 pm EST - Updated 3 October 2022, 10:52 pm EST
Hi.
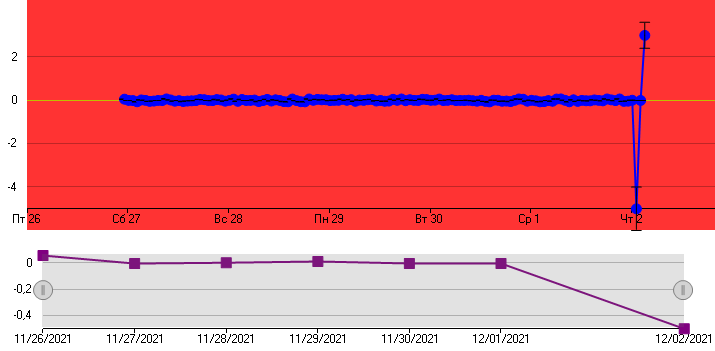
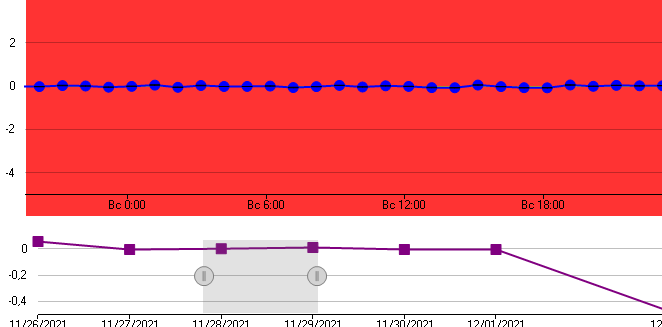
I have some data points of a magnitude, say 0.01 - 0.1. Then some outlier happens with value 10. Everything is rescaled to 10, so prevois values around 0.01 are simply look like laying on a single line around 0. When I look at a whole picture with all points it is ok, normal behavoir. But then I use range selector to navigate to the points of the same small magnitude (~0.01), but nothing changed, I’m still rescaled to AxisY max value around 10.
Look pictures for more info.
My code can be found here - https://drive.google.com/file/d/1ib1wes-quVN43TvJw10XNNJNEVYEqFAx/view?usp=sharing