FlexChart Data Labels

Posted by: aroblesv on 25 April 2024, 4:11 pm EST

  • Posted 25 April 2024, 4:11 pm EST

    Dear support team,

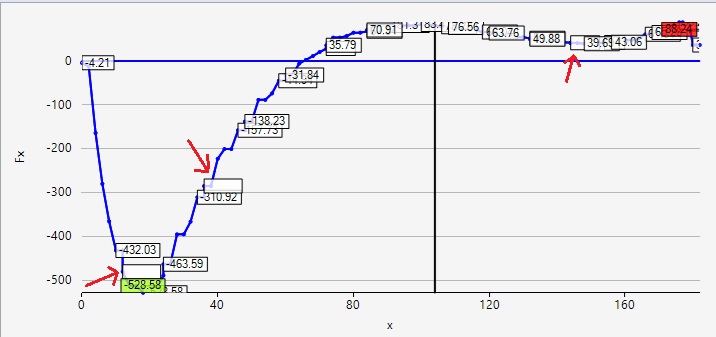
    I’m using the following code to add DataLabels to FlexChart (vb.net 6.0), but this will add labels to all data points. Is there a way to add labels to specific points? Also, as I understand, there is no Interaction Actions menu as in old C1Chart, so is it possible to add zoom in/out and pan interactions to FlexChart?

    Regards,

    [code]'Set chart’s DataLabels value

    linfluenciaR_806.chart1_806.DataLabel.Content = “{y}”

    'Set template string to create custom content for data labels

    linfluenciaR_806.chart1_806.DataLabel.Content = “{value}”

    'Set chart’s DataLabels position

    linfluenciaR_806.chart1_806.DataLabel.Position = LabelPosition.Auto

    'Set to show data labels borders

    linfluenciaR_806.chart1_806.DataLabel.Border = True

    'Style data labels

    linfluenciaR_806.chart1_806.DataLabel.Style.Font = New Font(FontFamily.GenericSansSerif, 8, FontStyle.Regular)

    linfluenciaR_806.chart1_806.DataLabel.BorderStyle.StrokeColor = Color.Black

    linfluenciaR_806.chart1_806.DataLabel.BorderStyle.FillColor = Color.White[/code]

  • Posted 26 April 2024, 4:47 am EST

    Hello,

    As of now, there is no direct way to set the label for each item individually but you can handle the LabelRendering event of FlexChart to hide the labels based on different conditions.

    Please find the attached sample implementing the same.

    WindowsFormsApp6.zip

    >>so is it possible to add zoom in/out and pan interactions to FlexChart?

    Please see the following documentation link demonstrating the same:

    https://developer.mescius.com/componentone/docs/win/online-flexchart/zoom.html

    Regards,

    Prabhat Sharma.

  • Posted 29 April 2024, 12:16 pm EST

    Hello Prabhat Sharma,

    Thanks for your reply. Could you please provide example in visual basic. I haven’t been able to make the code work.

    Regards,

  • Posted 29 April 2024, 11:05 pm EST

    Hello,

    Please find the vb.net version of the last attached sample below:

    FlexChartDataLabels_VB.zip

    Regards,

    Prabhat Sharma.

  • Posted 2 May 2024, 1:20 pm EST

    Hello Prabhat Sharma,

    Thanks a lo for the example. Code is now working as expected. Is it possible to change DataLabel.BorderStyle.FillColor property for a specific label using LabelRendering event?

    For a set of data points, we would like to highlight with a different color labels for maximum and minimum values.

    Regards,

  • Posted 3 May 2024, 10:15 am EST

    Hi Alfredo,

    Considering your use-case, you first need to determine the smallest and largest values of the data label bound property. This information can be found using the FlexChart’s DataSource.

    Then, use the FlexChart’s LabelRendering event to draw a border around the desired labels using RenderDataLabelEventArgs.Graphics property as shown in the following code:

    Private Sub FlexChart1_LabelRendering(sender As Object, e As RenderDataLabelEventArgs)
         If e.Text = minVal.ToString() Then
             Dim s As SizeF = e.Graphics.MeasureString(e.Text, FlexChart1.Font)
             Dim rectangle As New Rectangle(New Point(CInt(e.Point.X), CInt(e.Point.Y)), New Size(CInt(s.Width), CInt(s.Height)))
             e.Graphics.DrawRectangle(New Pen(Color.Red), rectangle)
         End If
         If e.Text = maxVal.ToString() Then
             Dim s As SizeF = e.Graphics.MeasureString(e.Text, FlexChart1.Font)
             Dim rectangle As New Rectangle(New Point(CInt(e.Point.X), CInt(e.Point.Y)), New Size(CInt(s.Width), CInt(s.Height)))
             e.Graphics.DrawRectangle(New Pen(Color.Green), rectangle)
         End If
     End Sub

    Kindly refer to the attached sample for full implementation.

    FlexChartDataLabels_VB_Mod.zip

    Thanks & Regards,

    Aastha

  • Posted 7 May 2024, 2:42 pm EST - Updated 7 May 2024, 2:47 pm EST

    Hello Aastha,

    Thanks for your reply. We decided to manage labels using Annotations, due to unexpected behavior observed when using Flexchart labels (i.e. LabelRendering settings are lost each time Flexchart is refreshed). Annotations is working fine, just a minor bug is seen. Some rectangles appear without text (it seems to be random). Please refer to attached image.

    Regards,

  • Posted 8 May 2024, 5:28 am EST

    Hi Alfredo,

    Unfortunately, we could not replicate the issue on our end. Please refer FlexChartDataLabels_VB_Mod.zip

    We kindly request you update the attached sample or provide a stripped-down version of your sample application so that we can replicate the issue on our end.

    If you can replicate the issue with the attached sample as well, then please share your environment details with us:

    1. OS version
    2. VS version
    3. Exact version of the C1FlexChart control that you are using
    4. Locale settings of your system
    5. Display setting of your system
    6. Are you working on a VM?
    7. Are you working via RDP?

    Thanks & Regards,

    Aastha

  • Posted 13 May 2024, 2:19 pm EST

    Hello Aastha,

    Here is the code we are using for multiple Annotations.

    Environment details are: Windows 11, Visual Studio 2022 (Net 6.0), Flexchart 6.0.20232.611, Display settings 1920 x 1080.

    Regards,

    FlexChart Annotations.zip

  • Posted 14 May 2024, 8:46 am EST

    Hi Alfredo,

    Thanks for providing the requested environment details.

    From the code snippet you provided, the issue seems to be particular to the project implementation, especially how you handle your chart data for rendering the label border. Instead of drawing the rectangles using Graphics, you used an annotation layer to render them. This code does not provide enough information to determine the entire implementation. To reproduce the issue on our end, we would appreciate it if you could send us a stripped-down version of your sample application with some dummy data. This will help us to thoroughly analyze the issue and provide you with a more detailed solution.

    Your cooperation is highly appreciated.

    Thanks & Regards,

    Aastha

  • Posted 17 May 2024, 3:36 pm EST

    Hello Aastha,

    Thanks for your help. We found the reason why some rectangles appeared without text. Rectangle content was added with text format (i.e Format(valmaxtot, “###,###,##0.00”)), but rectangle Width was calculated using MeasureText without text format. This was causing content not to fit within the rectangle. After fixing issue, Annotations is now working as expected.

    Regards,

  • Posted 20 May 2024, 12:06 am EST

    Hi Alfredo,

    We’re glad to hear that you’ve identified the root cause of the issue and found a solution. Thank you for letting us know.

    Please feel free to reach out to us, if you have any further queries.

    Kind Regards,

    Aastha

Need extra support?

Upgrade your support plan and get personal unlimited phone support with our customer engagement team

Learn More

Forum Channels