Posted 19 November 2021, 12:28 pm EST
Hi.
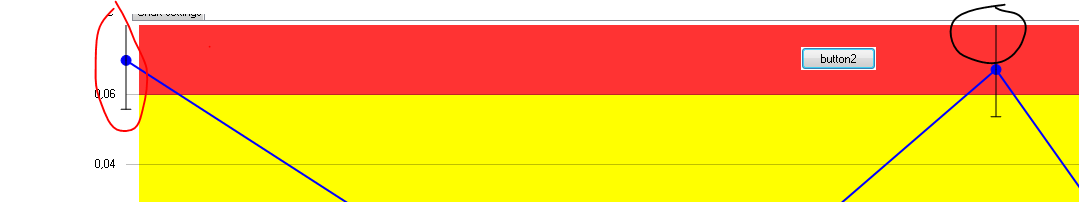
I have data – value, it’s confidence interval and datetime. I want to display
error bar for each value.
I have following coniguration code:
            flexChart3.Series.Clear();

            var valueCoord = new Series
            {
                    Name = "value",
                    Binding = "Value",
                    BindingX = "Date",
                    ChartType = ChartType.LineSymbols,
                    Style =
                    {
                            FillColor = Settings.Default.MainChartColor,
                            StrokeColor = Settings.Default.MainChartColor
                    }
            };
            flexChart3.Series.Add(valueCoord);

            var bar = new ErrorBar
            {
                    BindingX = "Date",
                    Binding = "Sigma",

                    Name = "Sigma1",
                    ErrorAmount = ErrorAmount.StandardError
            };

            flexChart3.Series.Add(bar);


            flexChart3.ToolTip.Content = $"{ComponentName} : {{Value}}\rDate: {{Date}}";
and datasource class
 public class Class
    {
        #region Properties

        public double Value { get; set; }
        public DateTime Date { get; set; }
        public double Sigma { get; set; }
        #endregion
    }
(datasoruce is collection of Class entities)
So, for each value I have some sigma (or conf. interval) and I want to display it as error bar. How can I achieve this?
Thanks in advance