FlexChart - Multi Y-Axis Request

Posted by: alex.corti on 20 February 2024, 10:13 am EST

    • Post Options:
    • Link

    Posted 20 February 2024, 10:13 am EST

    Good morning,

    a client needs to show n Y axes as many series as are shown on the screen.

    Each Y-axis must have its own scale and a label identifying it.

    An additional request is to have the Y-axis of the same series color.

    Is this possible ?

    In the current solution (see image) the software shows only one Y-axis on both sides.

    Now it would like to see 6 on the left side: one for each series (CH4, CO … , NH3) each with its own scale, label and if possible with axis color equal to the color of the series.

    Thanks Alex

  • Posted 20 February 2024, 10:14 am EST - Updated 20 February 2024, 10:19 am EST

  • Posted 21 February 2024, 9:05 am EST

    Hello Alex,

    For each series you add, you can set a y-axis and color it by getting the palette color as follows:

    _chart.Series.Clear();
    for(int i=0; i<6; i++) //adding 6 series
    {
        _chart.Series.Add(new Series
        {
            Binding = $"Y{i + 1}",
            Name = $"Y{i + 1}",
            AxisY = new Axis
            {
                Position = C1.Chart.Position.Left,
                Style =
                {
                    StrokeColor = Color.FromArgb((int)(_chart as C1.Chart.IPalette).GetColor(i))
                }
            }
        });
    }


    Please refer to the attached sample for implementation. (see FlexChart_MultipleYAxis.zip)

    Regards,

    Uttkarsh.

  • Posted 21 February 2024, 9:43 am EST

    Thanks Uttkarsh,

    The example works so I will adapt it on my sw.

    Great job.

    Alex

  • Posted 22 February 2024, 1:20 am EST

    Hello Alex,

    We are glad to know that the solution works for you.

    If you have any more queries or require any further assistance, please feel free to contact us.

    Regards,

    Uttkarsh.

  • Posted 4 June 2024, 10:41 am EST - Updated 4 June 2024, 10:47 am EST

    Based on an example you provided, I tried to implement the solution with multi-axis, but I have this anomaly:

    The ordinate axis values do not match what is visible on the screen.

    I can’t set the colors: the code goes in error so I commented it out.

    In the image here is a clear example:

    CH4 Value = 9.66 but the axis shows that the point is between 6 and 8

    NOX Value = 251.87… but the axis shows between 0 and 50

    This is not acceptable to the Client how can I solve it?

  • Posted 4 June 2024, 10:42 am EST

    private bool plot_Trend()

    {

    bool exitResult = true;

    string toolTipLineMaker = “”;

    System.Windows.Forms.Cursor.Current = System.Windows.Forms.Cursors.WaitCursor;

    try

    {

    string colName = _AnaComboDataTypeList.Where(q => q.Id == ((comboBoxElement)cbDataType.SelectedItem).id).FirstOrDefault().ColumnName; // “dt_value”;

    string firstAvgTableName = _AnaComboAvgTypeList[0].TableName;

    if (cbAvgType.SelectedIndex == 0)

    {

    _fChart.AxisX.Min = _fChart.AxisX.Max = double.NaN;

    _fChart.AxisY.Min = _fChart.AxisY.Max = double.NaN;

    }

    _fChart.AxisX.LabelAngle = -45; // range da -90 a + 90

    //_fChart.AxisX.OverlappingLabels = OverlappingLabels.Auto;

    //_fChart.AxisX.StaggeredLines = 2; // su quante linee mostra le etichette dei valori

    _fChart.Legend.Position = Position.Right;

    _fChart.Series.Clear();

    _fChart.ChartType = ChartType.Line; // LineSymbols

    if(cbChartType.SelectedIndex == 1)

    {

    _fChart.AxisY.AxisLine = false;

    }

    tmrReal.Enabled = false;

    tmrReal.Stop();

    createDataSource(colName);

         //Binding chart's AxisX to 'Date' so Dates are shown in Horizontal axis
         _fChart.BindingX = "dt_date";
         toolTipLineMaker = toolTipLineMaker + "{dt_date}\r\n";
    
         //Adding a Series to chart and binding it (AxisY)
         int AxisY = 0; string seriesName;
         foreach (WasMeasures selected in _ListaParametriSelezionati)
         {
             seriesName = selected.CMStationCode + " - " + selected.C3 + " [" + selected.C4 + "]";
             
             
             _fChart.ToolTip.Content = _fChart.ToolTip.Content + seriesName + "\r\n";
             // Assi diversi per ogni serie con min e max: sembra creare confusione !!
             //_fChart.Series[AxisY].AxisY = new Axis { Position = Position.Left }; //, Min = Convert.ToDouble( selected.C8) , Max = Convert.ToDouble(selected.C10)};
             if (cbChartType.SelectedIndex == 0)
             {
                 _fChart.Series.Add(new C1.Win.Chart.Series { Name = (seriesName), Binding = selected.CMStationCode+"#"+selected.C2 });
                 _fChart.Series[AxisY].AxisY = new Axis
                 {
                     Position = (AxisY == 0 ? Position.Left : Position.None),
                     Min = Convert.ToDouble(0),
                     Max = Convert.ToDouble(100)
                 };
             }
             else
             {
                 AxisY_MinMaxValues measSelected = _minMaxList.Where(q => q.C2 == selected.C2 && q.StationCode == selected.CMStationCode).FirstOrDefault();
                 _fChart.Series.Add(new Series
                 {
                     Binding = selected.CMStationCode+"#"+selected.C2,
                     Name = seriesName,
                     AxisY = new Axis
                     {
                         Position = Position.Left,
                         Min = Convert.ToDouble(0),
                         Max = measSelected.MaxFromDB,
                         Title = measSelected.name,
                         Style =
                             {
                                 StrokeColor = Color.FromArgb((int)(_fChart as C1.Chart.IPalette).GetColor(AxisY))
                             }
                     }
                 });
    
                 //_fChart.Series[AxisY].AxisY = new Axis
                 //{
                 //    Position = Position.Left,
                 //    Min = Convert.ToDouble(0),
                 //    Max = measSelected.MaxFromDB,
                 //    Title = measSelected.name,
                 //    Style =
                 //    {
                 //        StrokeColor = Color.FromArgb((int)(_fChart as C1.Chart.IPalette).GetColor(AxisY))
                 //    }
                 //};
             }
    
             AxisY++;
         }
    
         // Aggiunta per la finta scala a destra
         if (cbChartType.SelectedIndex == 0)
         {
             _fChart.Series.Add(new C1.Win.Chart.Series { Name = (""), Binding = "hidden_Col" });
             _fChart.Series[AxisY].AxisY = new Axis
             {
                 Position = (_ListaParametriSelezionati.Count > 1 ? Position.Right : Position.None),
                 Min = Convert.ToDouble(0),
                 Max = Convert.ToDouble(100)
             };
             _fChart.Series[0].AxisY.MajorGrid = true;
         }
             
    
         txtZoom.Enabled = _ListaParametriSelezionati.Count > 1 && cbChartType.SelectedIndex == 0 ? true : false;
         btnZoom.Enabled = _ListaParametriSelezionati.Count > 1 && cbChartType.SelectedIndex == 0 ? true : false;
                       
         // Limit series 20211104 : il limite di legge va messo solo se ho una sola misura !!!
         double maxValue = 0;
    
         if (_ListaParametriSelezionati.Count == 1)
         {
             //Creating and adding TrendLine series
             TrendLine _trendLine = new C1.Win.Chart.TrendLine();
             string Cx = "";
             switch (_AvgTypeSelected.TableName.ToUpper())
             {
                 case "WDS_HALF":
                     Cx = _ListaParametriSelezionati[0].C28 == null ? "0" : _ListaParametriSelezionati[0].C28.Replace(".", ",");
                     break;
                 case "WDS_ELAB":
                     Cx = _ListaParametriSelezionati[0].C30 == null ? "0" : _ListaParametriSelezionati[0].C30.Replace(".", ",");
                     break;
                 case "WDS_DAYS":
                     Cx = _ListaParametriSelezionati[0].C31 == null ? "0" : _ListaParametriSelezionati[0].C31.Replace(".", ",");
                     break;
                 case "WDS_MONTH":
                     Cx = _ListaParametriSelezionati[0].C33 == null ? "0" : _ListaParametriSelezionati[0].C33.Replace(".", ",");
                     break;
                 case "WDS_YEAR":
                     Cx = _ListaParametriSelezionati[0].C57 == null ? "0" : _ListaParametriSelezionati[0].C57.Replace(".", ",");
                     break;
                 case "BFMYYYYMMDD":
                     if (firstAvgTableName == "WDS_HALF")
                         Cx = _ListaParametriSelezionati[0].C28 == null ? "0" : _ListaParametriSelezionati[0].C28.Replace(".", ",");
                     else
                         Cx = _ListaParametriSelezionati[0].C30 == null ? "0" : _ListaParametriSelezionati[0].C30.Replace(".", ",");
                       break;
             }
             _trendLine.Name = "ELV " + _ListaParametriSelezionati[0].C3 + ": " + Cx;
             maxValue = Convert.ToDouble(Cx);
             List<double> levels = _dtExcel.AsEnumerable().Select(al => al.Field<double>(1)).Distinct().ToList();
             double max = levels.Max();
             _trendLine.AxisY = new Axis { Position = Position.None, Min = Convert.ToDouble(0), Max = ((maxValue < max) ? Convert.ToDouble(max) : Convert.ToDouble(maxValue + 1)) };
             if (maxValue > max)
                 _fChart.Series[0].AxisY.Max = Convert.ToDouble(maxValue + 1);
    
             _trendLine.Binding = _ListaParametriSelezionati[0].CMStationCode + "#" + _ListaParametriSelezionati[0].C2 + "_sup";
             _trendLine.Order = 4;
             _trendLine.Style.FillColor = _fChart.Series[0].Style.FillColor;  //Color.AntiqueWhite;
             _trendLine.FitType = FitType.AverageY;
             if (maxValue > 0) _fChart.Series.Add(_trendLine);
             /* // Tolti per permettere il tooltip personalizzato
             if (!_firstPlot && lineMarker != null) lineMarker.Remove();
             Font lineMarkerFont = new Font(FontFamily.GenericSansSerif, 8);
             lineMarker = new C1.Win.Chart.Interaction.LineMarker(_fChart);
             lineMarker.Lines = C1.Win.Chart.Interaction.LineMarkerLines.Both;
             lineMarker.VerticalPosition = 0.2;
             lineMarker.HorizontalPosition = 0.3;
             lineMarker.Alignment = C1.Win.Chart.Interaction.LineMarkerAlignment.Right;
             lineMarker.ForeColor = Color.Black;
             lineMarker.Font = lineMarkerFont;
             lineMarker.Interaction = C1.Win.Chart.Interaction.LineMarkerInteraction.Move;*/
             //lineMarker.Content = toolTipLineMaker.Substring(0, toolTipLineMaker.Length - 2);
         }
         // _fChart.LegendToggle = true;
    
         // Scroll X
         if (!_firstPlot)
         {
             if (_horizontalScrollbar != null) _horizontalScrollbar.Remove();
             //if (_verticalScrollbar != null) _verticalScrollbar.Remove();
             _horizontalScrollbar = null;
             //_verticalScrollbar = null;
         }
         _fChart.Rendering += (s, e) =>
         {
             if (_horizontalScrollbar != null) // && _verticalScrollbar != null)
             {
                 /*if (_realTimeUpdate)
                 {
                     _horizontalScrollbar.Remove();
                     _horizontalScrollbar = null;
                     _horizontalScrollbar = new C1.Win.Chart.Interaction.AxisScrollbar(_fChart.AxisX);
                     _horizontalScrollbar.LowerValue = _horizontalScrollbar.UpperValue - 20;
                     _realTimeUpdate = false;
                 }*/
                 return;
             }
    
             _horizontalScrollbar = new C1.Win.Chart.Interaction.AxisScrollbar(_fChart.AxisX);
             // 20211102 : Manuel ha chiesto che la barra fosse completa per tutti i grafici (l'utente sceglie lo zoom non noi)
             /*if (_AvgTypeSelected.Name == "5sec-ist")
             {
                 //_horizontalScrollbar.LowerValue = _horizontalScrollbar.UpperValue - 20;
                 _horizontalScrollbar.LowerValue = _horizontalScrollbar.UpperValue/4; // prima era -20 ora ho upper/8 => 1 h 
             }
                 
             else
                 _horizontalScrollbar.UpperValue = _horizontalScrollbar.LowerValue + 20;
             */
             //_verticalScrollbar = new C1.Win.Chart.Interaction.AxisScrollbar(_fChart.Series[1].AxisY);
         };
         _firstPlot = false;
         pnlGraph.Visible = true;
    
     }
     catch (Exception ex)
     {
    
         ctrlLogger.Error(System.Reflection.MethodBase.GetCurrentMethod().DeclaringType);
         ctrlLogger.Error(ex.Message + "\n" + ex.StackTrace);
         exitResult = false;
     }
     System.Windows.Forms.Cursor.Current = System.Windows.Forms.Cursors.Default;
     return exitResult;
    

    }

  • Posted 4 June 2024, 11:53 am EST - Updated 4 June 2024, 11:58 am EST

    I changed my code in this way:

    private bool plot_Trend()

    {

    bool exitResult = true;

    string toolTipLineMaker = “”;

    System.Windows.Forms.Cursor.Current = System.Windows.Forms.Cursors.WaitCursor;

    try

    {

    string colName = _AnaComboDataTypeList.Where(q => q.Id == ((comboBoxElement)cbDataType.SelectedItem).id).FirstOrDefault().ColumnName; // “dt_value”;

    string firstAvgTableName = _AnaComboAvgTypeList[0].TableName;

    _fChart.AxisX.Min = _fChart.AxisX.Max = double.NaN;

    if (cbAvgType.SelectedIndex == 0)

    _fChart.AxisY.Min = _fChart.AxisY.Max = double.NaN;

    else

    {

    _fChart.AxisY.Min = 0;

    //_fChart.AxisY.Max = 1000;

    }

    _fChart.AxisX.LabelAngle = -45; // range da -90 a + 90

    //_fChart.AxisX.OverlappingLabels = OverlappingLabels.Auto;

    //_fChart.AxisX.StaggeredLines = 2; // su quante linee mostra le etichette dei valori

    _fChart.Legend.Position = Position.Right;

    _fChart.Series.Clear();

    _fChart.ChartType = ChartType.Line; // LineSymbols

    if (cbChartType.SelectedIndex == 1)

    {

    _fChart.AxisY.AxisLine = false;

    _fChart.Legend.Position = Position.None;

    }

    tmrReal.Enabled = false;

    tmrReal.Stop();

    createDataSource(colName);

                //Binding chart's AxisX to 'Date' so Dates are shown in Horizontal axis
                _fChart.BindingX = "dt_date";
                toolTipLineMaker = toolTipLineMaker + "{dt_date}\r\n";
    
                //Adding a Series to chart and binding it (AxisY)
                int AxisY = 0; string seriesName; 
                double allMax = _minMaxList.Max(q=> q.MaxFromDB);
                if (cbChartType.SelectedIndex == 1)
                    _fChart.AxisY.Max = allMax;
                foreach (WasMeasures selected in _ListaParametriSelezionati)
                {
                    seriesName = selected.CMStationCode + " - " + selected.C3 + " [" + selected.C4 + "]";
                    _fChart.ToolTip.Content = _fChart.ToolTip.Content + seriesName + "\r\n";
                    // Assi diversi per ogni serie con min e max: sembra creare confusione !!
                    //_fChart.Series[AxisY].AxisY = new Axis { Position = Position.Left }; //, Min = Convert.ToDouble( selected.C8) , Max = Convert.ToDouble(selected.C10)};
                    if (cbChartType.SelectedIndex == 0)
                    {
                        _fChart.Series.Add(new C1.Win.Chart.Series { Name = (seriesName), Binding = selected.CMStationCode+"#"+selected.C2 });
                        _fChart.Series[AxisY].AxisY = new Axis
                        {
                            Position = (AxisY == 0 ? Position.Left : Position.None),
                            Min = Convert.ToDouble(0),
                            Max = Convert.ToDouble(100)
                        };
                    }
                    else
                    {
                        AxisY_MinMaxValues measSelected = _minMaxList.Where(q => q.C2 == selected.C2 && q.StationCode == selected.CMStationCode).FirstOrDefault();
                        if (allMax<measSelected.MaxFromDB)
                            allMax = measSelected.MaxFromDB;
                        _fChart.Series.Add(new Series
                        {
                            Binding = selected.CMStationCode+"#"+selected.C2,
                            Name = seriesName,
                            AxisY = new Axis
                            {
                                Position = Position.Left,
                                Min = Convert.ToDouble(0),
                                //Max = measSelected.MaxFromDB,
                                Title = measSelected.name,
                                Style =
                                    {
                                        StrokeColor = Color.FromArgb((int)(_fChart as C1.Chart.IPalette).GetColor(AxisY))
                                    }
                            }
                        });
                    }
    
                    AxisY++;
                }
    
                // Aggiunta per la finta scala a destra
                if (cbChartType.SelectedIndex == 0)
                {
                    _fChart.Series.Add(new C1.Win.Chart.Series { Name = (""), Binding = "hidden_Col" });
                    _fChart.Series[AxisY].AxisY = new Axis
                    {
                        Position = (_ListaParametriSelezionati.Count > 1 ? Position.Right : Position.None),
                        Min = Convert.ToDouble(0),
                        Max = Convert.ToDouble(100)
                    };
                    _fChart.Series[0].AxisY.MajorGrid = true;
                }
                //else
                //    _fChart.AxisY.Max = allMax;
    
                txtZoom.Enabled = _ListaParametriSelezionati.Count > 1 && cbChartType.SelectedIndex == 0 ? true : false;
                btnZoom.Enabled = _ListaParametriSelezionati.Count > 1 && cbChartType.SelectedIndex == 0 ? true : false;
    
                // Limit series 20211104 : il limite di legge va messo solo se ho una sola misura !!!
                double maxValue = 0;
    
                if (_ListaParametriSelezionati.Count == 1)
                {
                    //Creating and adding TrendLine series
                    TrendLine _trendLine = new C1.Win.Chart.TrendLine();
                    string Cx = "";
                    switch (_AvgTypeSelected.TableName.ToUpper())
                    {
                        case "WDS_HALF":
                            Cx = _ListaParametriSelezionati[0].C28 == null ? "0" : _ListaParametriSelezionati[0].C28.Replace(".", ",");
                            break;
                        case "WDS_ELAB":
                            Cx = _ListaParametriSelezionati[0].C30 == null ? "0" : _ListaParametriSelezionati[0].C30.Replace(".", ",");
                            break;
                        case "WDS_DAYS":
                            Cx = _ListaParametriSelezionati[0].C31 == null ? "0" : _ListaParametriSelezionati[0].C31.Replace(".", ",");
                            break;
                        case "WDS_MONTH":
                            Cx = _ListaParametriSelezionati[0].C33 == null ? "0" : _ListaParametriSelezionati[0].C33.Replace(".", ",");
                            break;
                        case "WDS_YEAR":
                            Cx = _ListaParametriSelezionati[0].C57 == null ? "0" : _ListaParametriSelezionati[0].C57.Replace(".", ",");
                            break;
                        case "BFMYYYYMMDD":
                            if (firstAvgTableName == "WDS_HALF")
                                Cx = _ListaParametriSelezionati[0].C28 == null ? "0" : _ListaParametriSelezionati[0].C28.Replace(".", ",");
                            else
                                Cx = _ListaParametriSelezionati[0].C30 == null ? "0" : _ListaParametriSelezionati[0].C30.Replace(".", ",");
                            break;
                    }
                    _trendLine.Name = "ELV " + _ListaParametriSelezionati[0].C3 + ": " + Cx;
                    maxValue = Convert.ToDouble(Cx);
                    List<double> levels = _dtExcel.AsEnumerable().Select(al => al.Field<double>(1)).Distinct().ToList();
                    double max = levels.Max();
                    _trendLine.AxisY = new Axis { Position = Position.None, Min = Convert.ToDouble(0), Max = ((maxValue < max) ? Convert.ToDouble(max) : Convert.ToDouble(maxValue + 1)) };
                    if (maxValue > max)
                        _fChart.Series[0].AxisY.Max = Convert.ToDouble(maxValue + 1);
    
                    _trendLine.Binding = _ListaParametriSelezionati[0].CMStationCode + "#" + _ListaParametriSelezionati[0].C2 + "_sup";
                    _trendLine.Order = 4;
                    _trendLine.Style.FillColor = _fChart.Series[0].Style.FillColor;  //Color.AntiqueWhite;
                    _trendLine.FitType = FitType.AverageY;
                    if (maxValue > 0) _fChart.Series.Add(_trendLine);
                    /* // Tolti per permettere il tooltip personalizzato
                    if (!_firstPlot && lineMarker != null) lineMarker.Remove();
                    Font lineMarkerFont = new Font(FontFamily.GenericSansSerif, 8);
                    lineMarker = new C1.Win.Chart.Interaction.LineMarker(_fChart);
                    lineMarker.Lines = C1.Win.Chart.Interaction.LineMarkerLines.Both;
                    lineMarker.VerticalPosition = 0.2;
                    lineMarker.HorizontalPosition = 0.3;
                    lineMarker.Alignment = C1.Win.Chart.Interaction.LineMarkerAlignment.Right;
                    lineMarker.ForeColor = Color.Black;
                    lineMarker.Font = lineMarkerFont;
                    lineMarker.Interaction = C1.Win.Chart.Interaction.LineMarkerInteraction.Move;*/
                    //lineMarker.Content = toolTipLineMaker.Substring(0, toolTipLineMaker.Length - 2);
                }
                // _fChart.LegendToggle = true;
    
                // Scroll X
                if (!_firstPlot)
                {
                    if (_horizontalScrollbar != null) _horizontalScrollbar.Remove();
                    //if (_verticalScrollbar != null) _verticalScrollbar.Remove();
                    _horizontalScrollbar = null;
                    //_verticalScrollbar = null;
                }
                _fChart.Rendering += (s, e) =>
                {
                    if (_horizontalScrollbar != null) // && _verticalScrollbar != null)
                    {
                        /*if (_realTimeUpdate)
                        {
                            _horizontalScrollbar.Remove();
                            _horizontalScrollbar = null;
                            _horizontalScrollbar = new C1.Win.Chart.Interaction.AxisScrollbar(_fChart.AxisX);
                            _horizontalScrollbar.LowerValue = _horizontalScrollbar.UpperValue - 20;
                            _realTimeUpdate = false;
                        }*/
                        return;
                    }
    
                    _horizontalScrollbar = new C1.Win.Chart.Interaction.AxisScrollbar(_fChart.AxisX);
                    // 20211102 : Manuel ha chiesto che la barra fosse completa per tutti i grafici (l'utente sceglie lo zoom non noi)
                    /*if (_AvgTypeSelected.Name == "5sec-ist")
                    {
                        //_horizontalScrollbar.LowerValue = _horizontalScrollbar.UpperValue - 20;
                        _horizontalScrollbar.LowerValue = _horizontalScrollbar.UpperValue/4; // prima era -20 ora ho upper/8 => 1 h 
                    }
    
                    else
                        _horizontalScrollbar.UpperValue = _horizontalScrollbar.LowerValue + 20;
                    */
                    //_verticalScrollbar = new C1.Win.Chart.Interaction.AxisScrollbar(_fChart.Series[1].AxisY);
                };
                _firstPlot = false;
                pnlGraph.Visible = true;
    
            }
            catch (Exception ex)
            {
    
                ctrlLogger.Error(System.Reflection.MethodBase.GetCurrentMethod().DeclaringType);
                ctrlLogger.Error(ex.Message + "\n" + ex.StackTrace);
                exitResult = false;
            }
            System.Windows.Forms.Cursor.Current = System.Windows.Forms.Cursors.Default;
            return exitResult;
        }
    

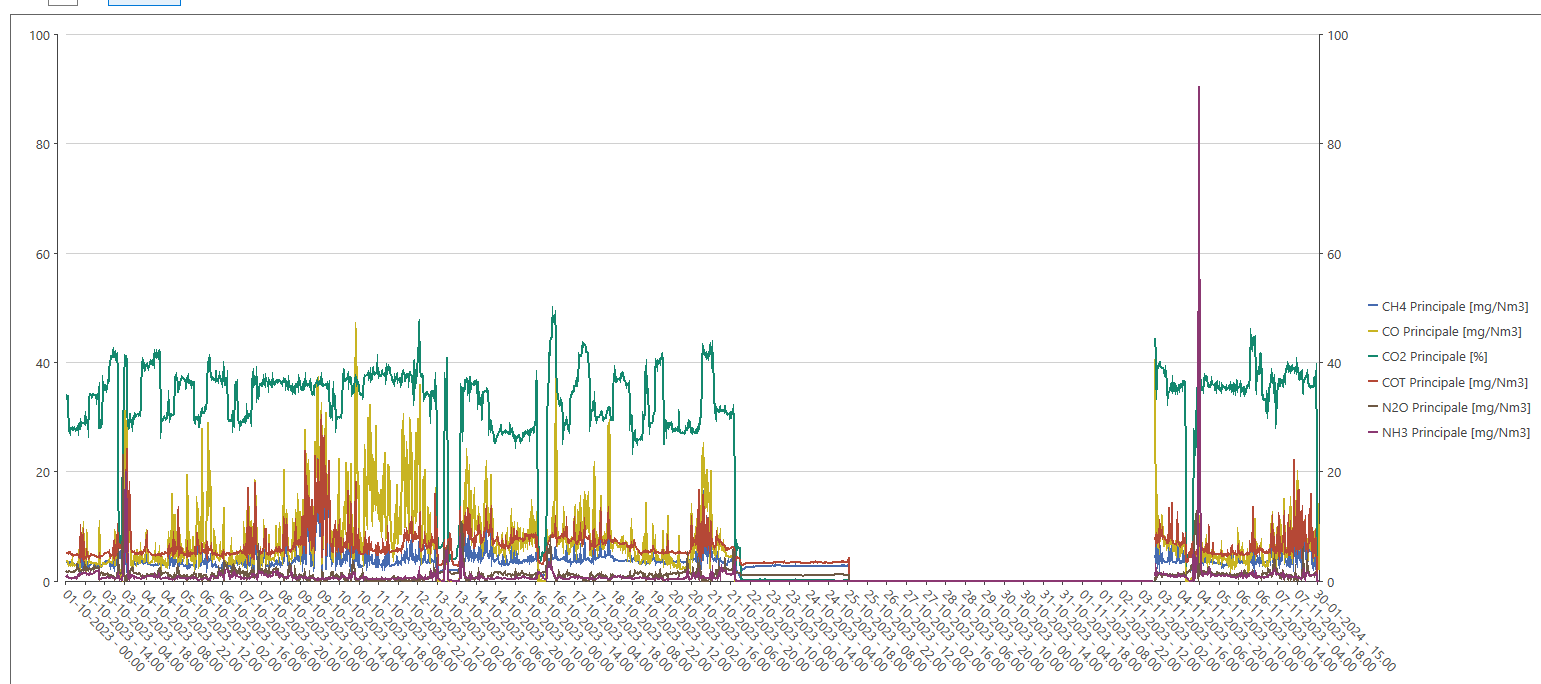
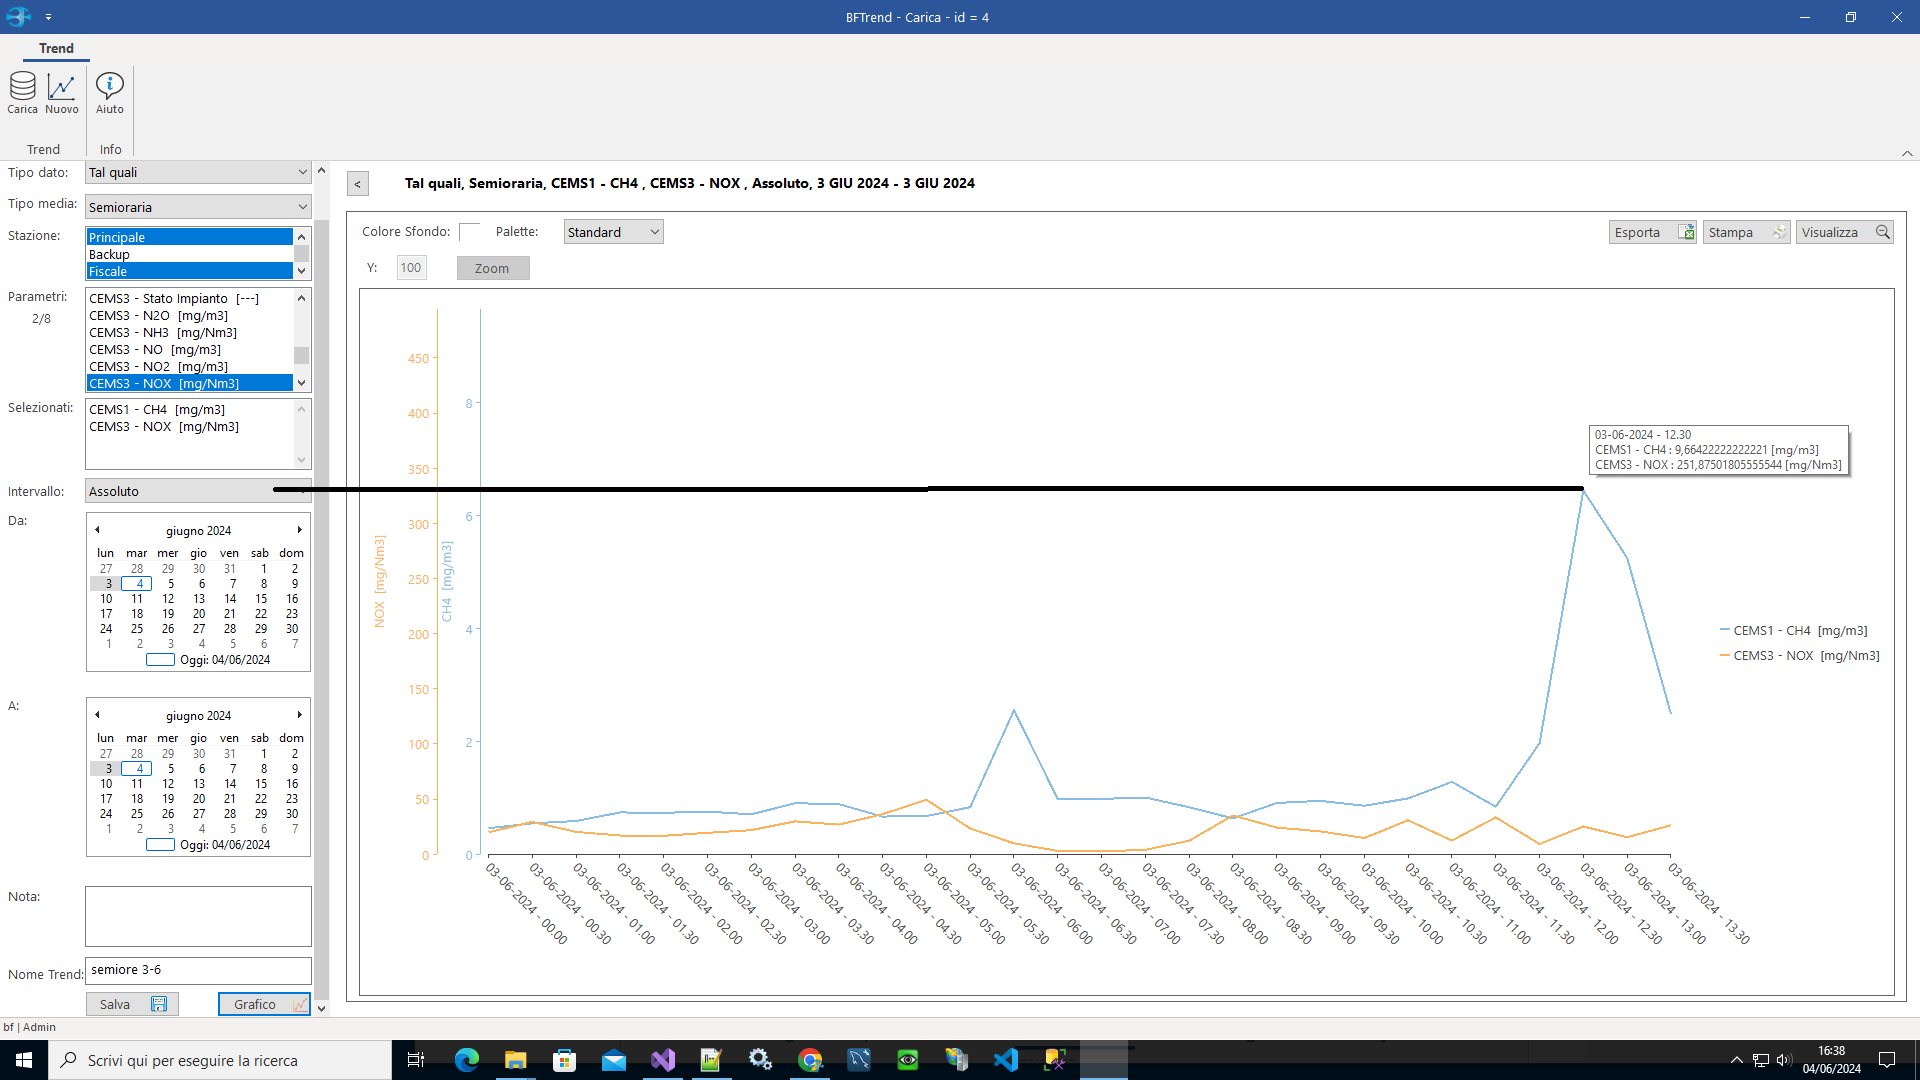
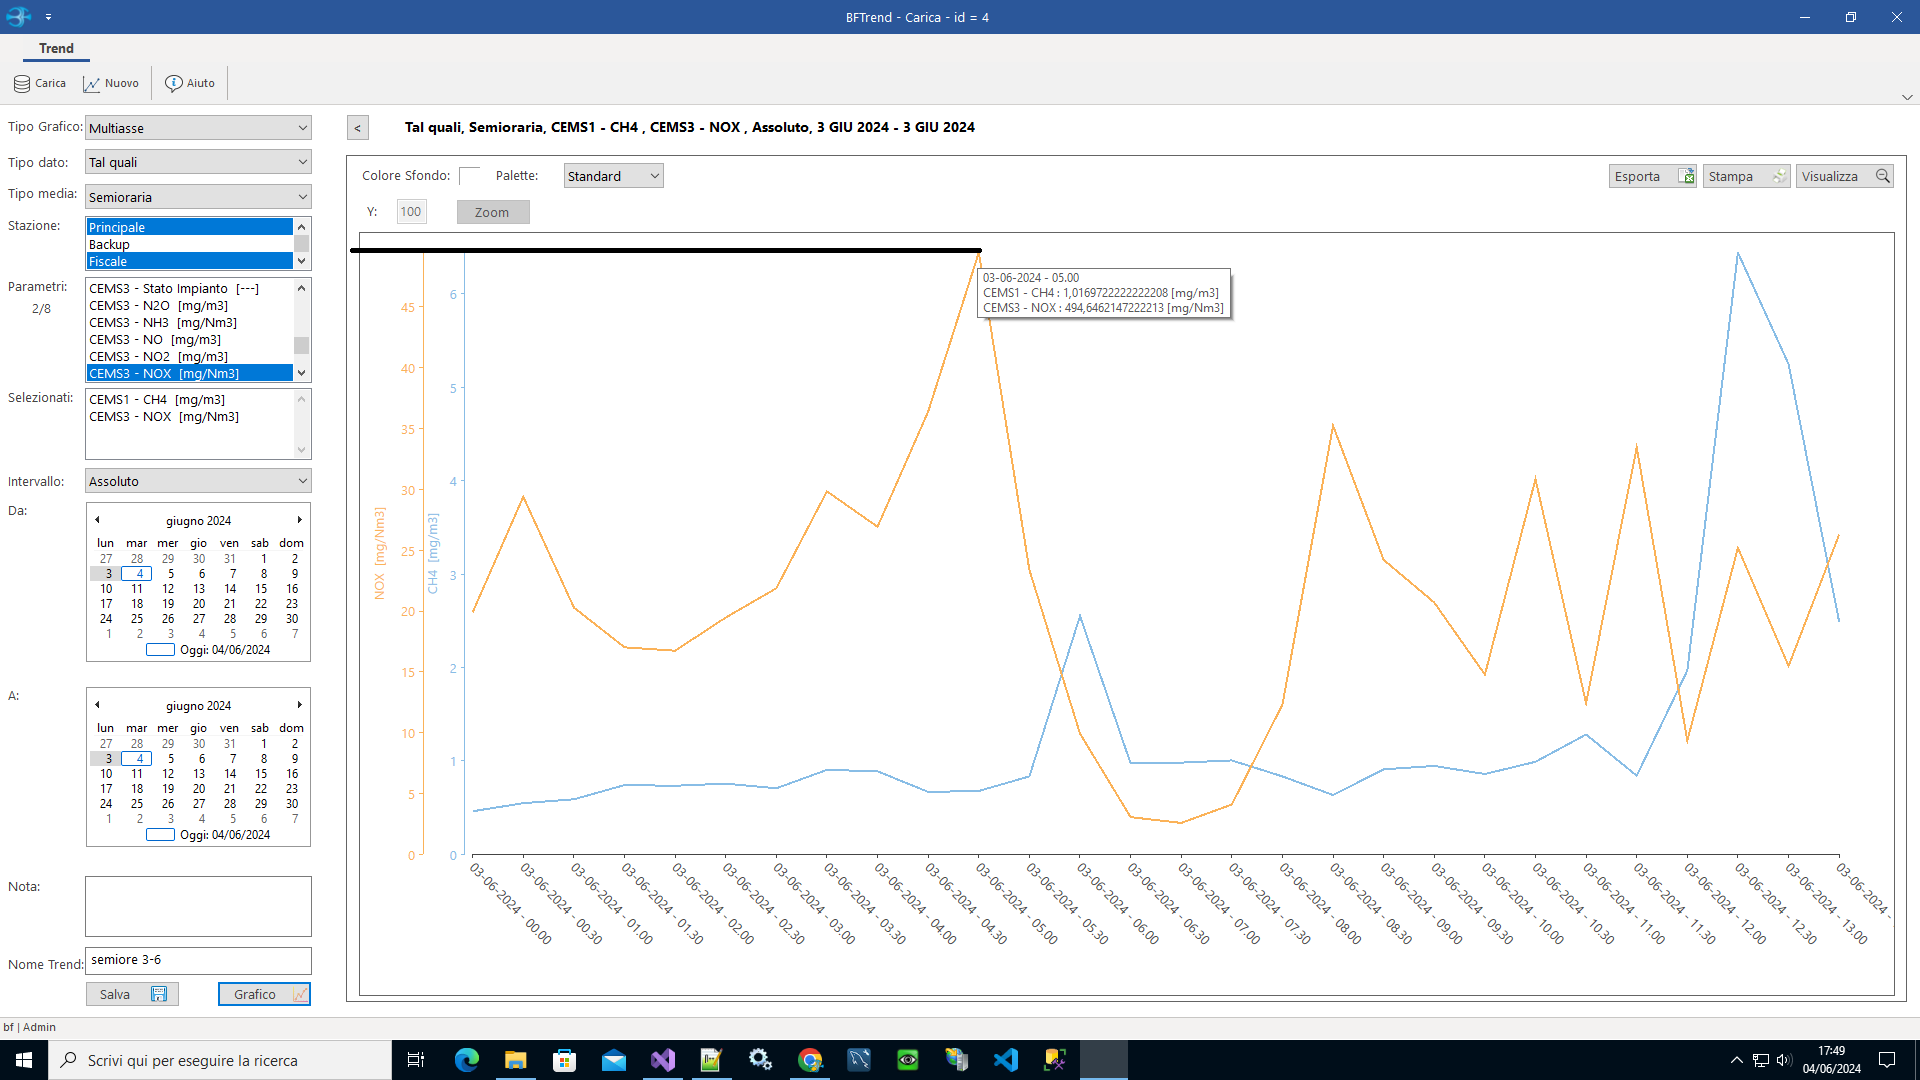
    The data are now correctly proportioned, but the values on the axes are not correct .

    It seems that these two instructions (BOLD) conflict:

    double allMax = _minMaxList.Max(q=> q.MaxFromDB);

    if (cbChartType.SelectedIndex == 1)

    _fChart.AxisY.Max = allMax;

    AxisY = new Axis

    {

    Position = Position.Left,

    Min = Convert.ToDouble(0),

    //Max = measSelected.MaxFromDB,

    Title = measSelected.name,

    Style =

    {

    StrokeColor = Color.FromArgb((int)(_fChart as C1.Chart.IPalette).GetColor(AxisY))

    }

    }

  • Posted 5 June 2024, 3:22 am EST

    Hello Alex,

    We have replied to your other case on our portal for the same query. [case ID: CAS-49962-H8Q8B9]

    Please continue the thread there only to avoid any misunderstandings.

    Regards,

    Uttkarsh

Need extra support?

Upgrade your support plan and get personal unlimited phone support with our customer engagement team

Learn More

Forum Channels