Posted 25 July 2019, 1:35 pm EST - Updated 4 October 2022, 1:01 am EST
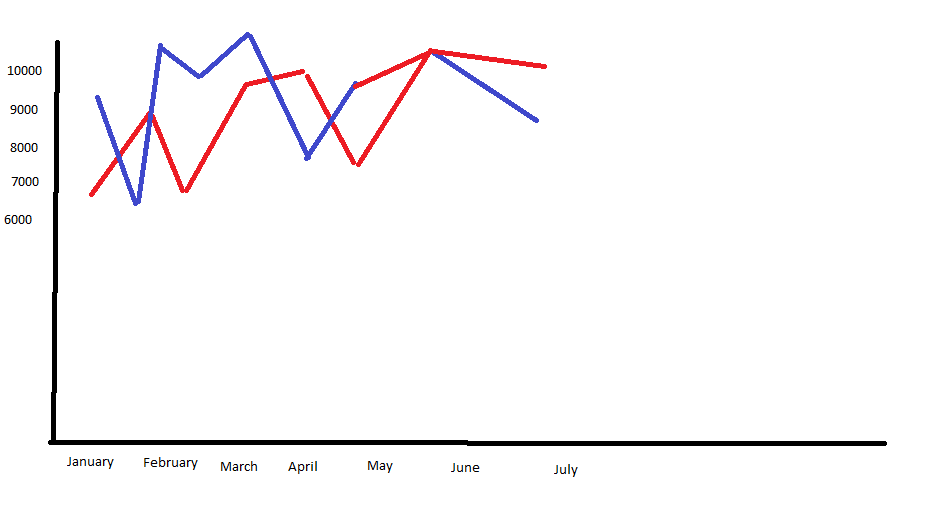
I am working in VB (Win Forms) with the FlexGrid and I am trying to figure out how to do something. I have a table that contains one row for each sales rep. Each row contains a field containing their name and 12 field corresponding to months containing total orders for that rep for that month. I am trying to figure out how to create a line chart (using VB) that will do the following:
- the Y Axis will be the dollar amount
- The X axis will show the months
- Each user will have a “line” on the chart in a different colour showing their total sales for each month.
The month value are all columns in the same row - one row per user.
This is an illustration of what I am trying to do.
Thanks,
Mike

