How to draw a const horizontal line chart, With a label associated

Posted by: itzik on 17 June 2019, 12:28 pm EST

    • Post Options:
    • Link

    Posted 17 June 2019, 12:28 pm EST - Updated 4 October 2022, 1:08 am EST

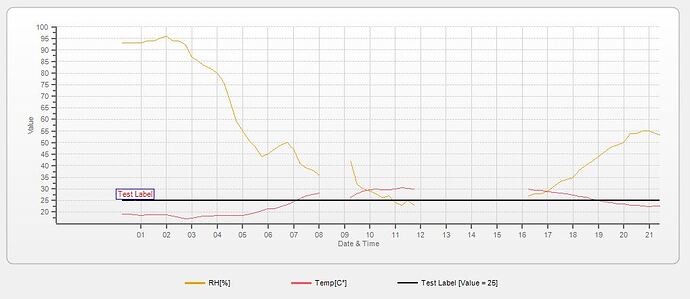
    Hi, I trying to create a new DataSeries and draw horizontal line with const Y value. The goal is to create a constant line throughout the graph so that even if we move the graph the line will remain throughout the entire X axis.

    Also, I need to assign a label to the line that will fixed to the left side of the graph, even if I move the graph sideways.

    Attached picture for illustration.
  • Posted 18 June 2019, 3:26 am EST

    Hi Itzik,

    I have answered this query at your S1 Case (http://supportone.componentone.com/home/casedetail/385004). So, please refer the specified S1 case for further responses.

    Thanks,

    Basant

Need extra support?

Upgrade your support plan and get personal unlimited phone support with our customer engagement team

Learn More

Forum Channels