Posted 11 June 2025, 11:22 am EST - Updated 11 June 2025, 11:29 am EST
Hello,
I’m encountering a couple of issues while migrating from C1Chart to FlexChart, as I’m updating my project to .NET 8 using WinForms.
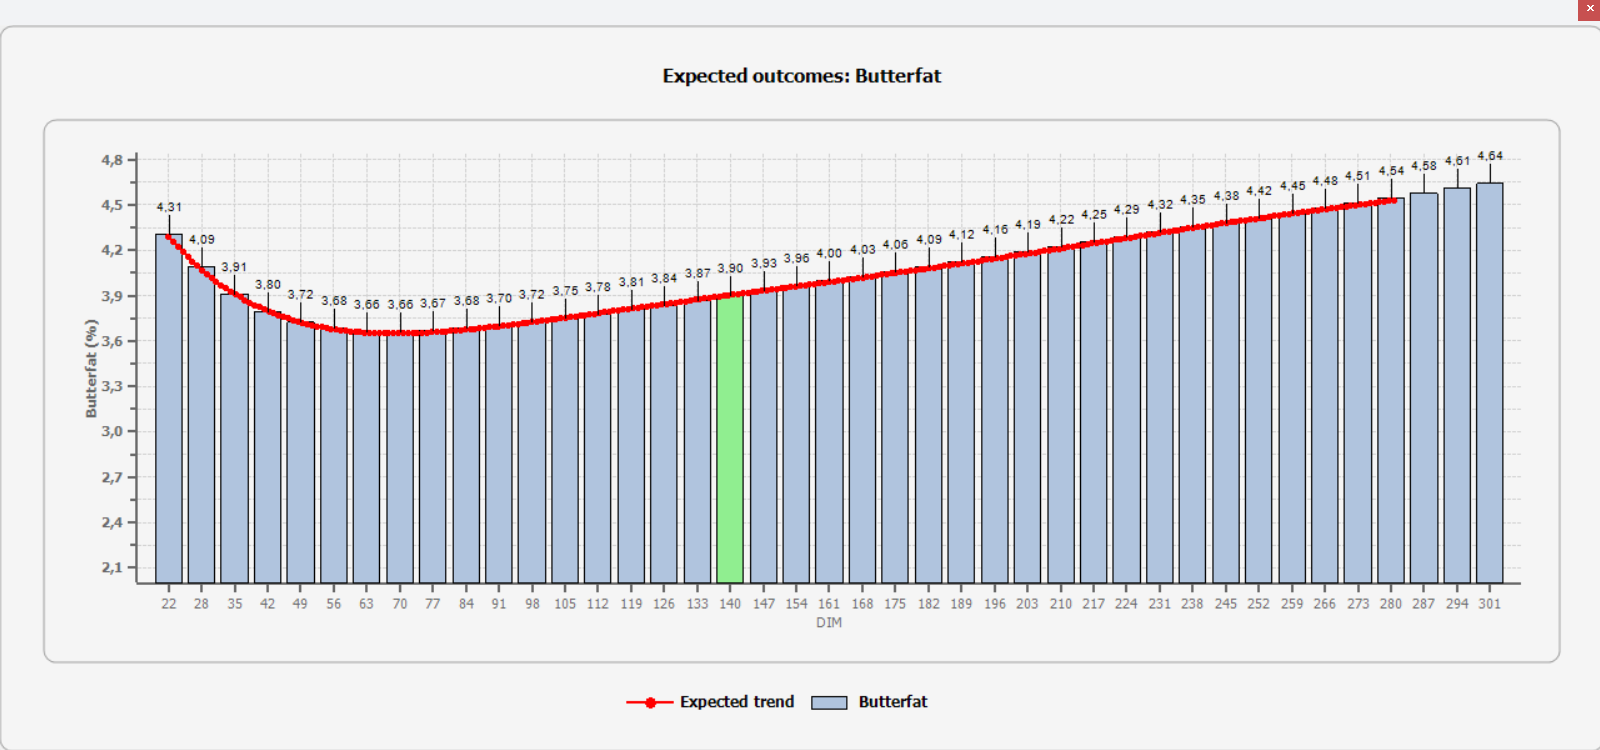
I have a chart that originally used a bar series and a line series (with points), like this:
With FlexChart, I’m struggling with two main things:
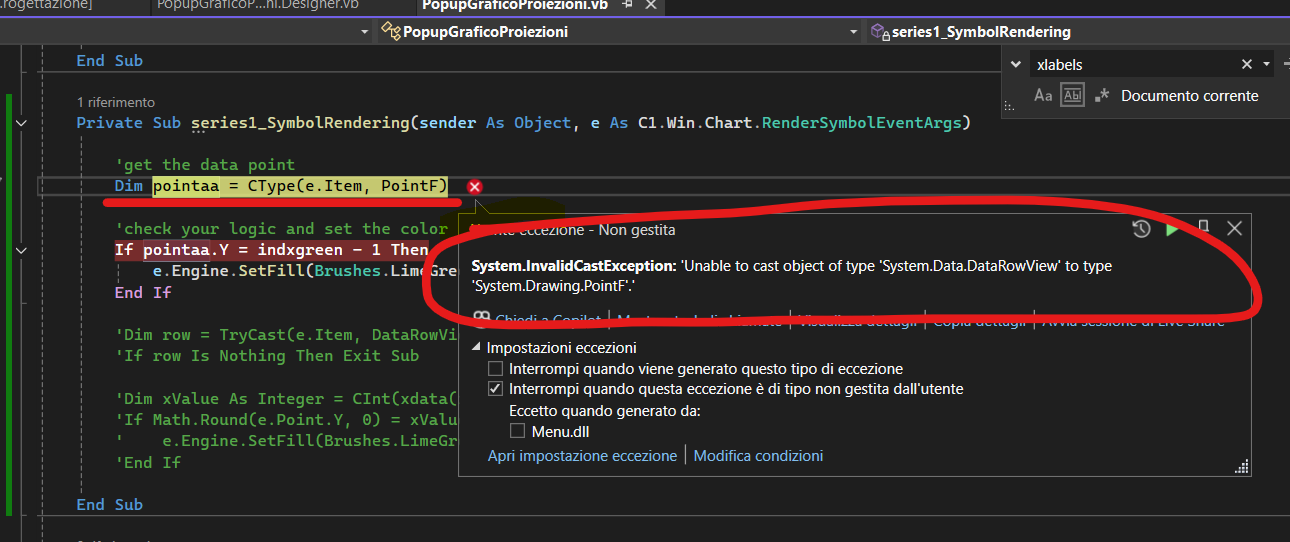
Coloring a specific bar:
In C1Chart, I used PointStylesList to change the color of a single bar. I can’t find a way to do this in FlexChart.
Using both bars and lines in the same chart:
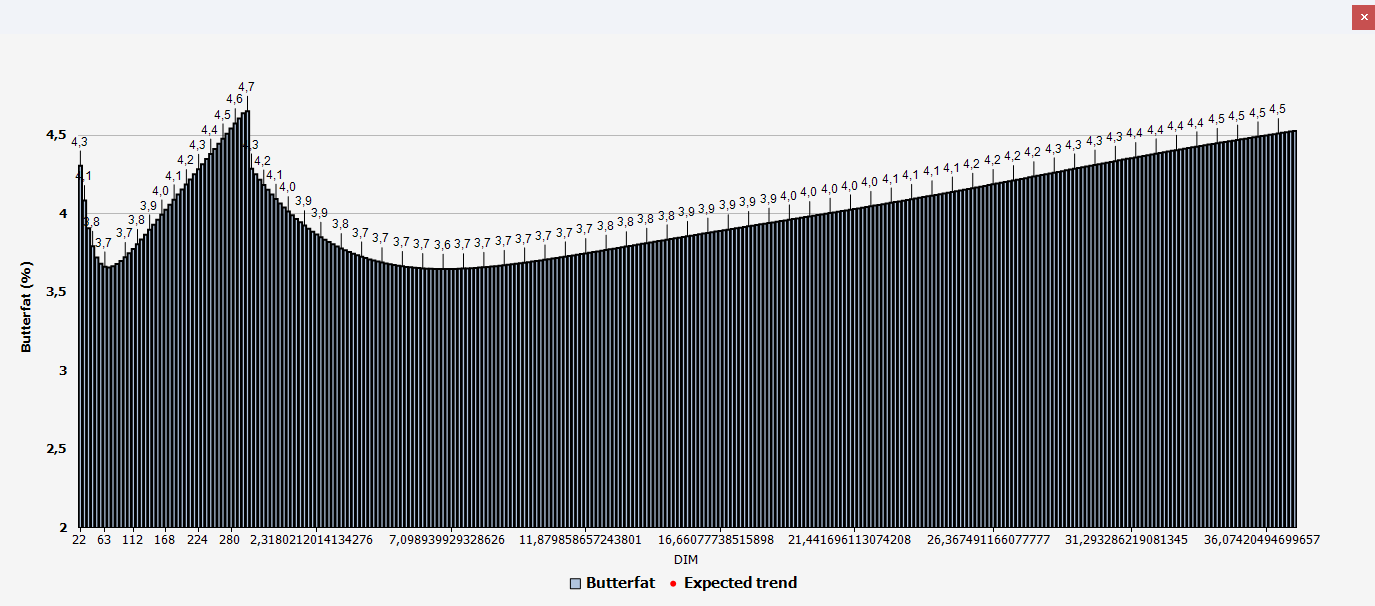
If I add only the bar series, the chart renders fine. If I add only the line series, it also works.
But when I try to add both, it renders incorrectly — the whole chart takes on the chart type of whichever series is added first (all bars or all lines).
Below is the working code I used with C1Chart:
[code] Private Sub CaricaGraficoProiezioni()
Me.Size = New Size(1300, 620)
Me.Location = New System.Drawing.Point(160, 165)
    Dim i, d As Integer
    Dim sty2 As Style = C1ChartProiezioni.Style
    sty2.BackColor = Color.WhiteSmoke
    sty2.BackColor2 = Color.WhiteSmoke
    Dim bord2 As Border = sty2.Border
    bord2.Rounding.All = 10
    bord2.Thickness = 1
    sty2 = C1ChartProiezioni.Legend.Style
    sty2.BackColor = Color.WhiteSmoke

    C1ChartProiezioni.ChartArea.AxisY.Text = etichetta & If(um <> "", " (" & um & ")", "")
    C1ChartProiezioni.ChartArea.AxisX.Text = trad.TradMsg("Giorni di lattazione")

    Dim NRec As Integer = arrayserie.Length - 2
    Dim xDIM() As Double
    Dim xdata() As Double
    Dim xdata0() As Double
    Dim xlabels() As String
    Dim ydata1() As Double
    Dim ydata2() As Double
    Dim ydata3() As Double
    Dim PolinomialCurve As Boolean = True

    ReDim xDIM(NRec - 1)
    ReDim xdata(NRec - 1) : ReDim xdata0(NRec - 2)
    ReDim xlabels(NRec - 1)
    ReDim ydata1(NRec - 1)
    ReDim ydata2(NRec - 1)
    ReDim ydata3(NRec - 1)

    For i = 0 To NRec - 1
        xdata(i) = i
        If i < NRec - 1 Then xdata0(i) = i
        xDIM(i) = Scheda.Dati(SchedaSelezionata).Raz.projDIM(i + 1)
        xlabels(i) = Scheda.Dati(SchedaSelezionata).Raz.projDIM(i + 1)
        ydata1(i) = arrayserie(i + 1)
        If idxitem = 7 Then
            ydata2(i) = Math.Round(arrayserie1(i + 1), 1)
        ElseIf idxitem = 8 Then
            ydata3(i) = Math.Round(arrayserie2(i + 1), 1)
        End If
    Next

    Dim ValMaxY0 As Single
    For i = 0 To NRec - 1
        If ydata1(i) > ValMaxY0 And Not IsInfinityDbl(ydata1(i)) Then
            ValMaxY0 = ydata1(i)
        End If
    Next

    Dim ValMinY As Single = ydata1(0)
    For i = 1 To NRec - 1
        If ydata1(i) < ValMinY Then
            ValMinY = ydata1(i)
        End If
    Next

    If ValMinY < 0 Then
        C1ChartProiezioni.ChartArea.AxisY.Min = Math.Round(ValMinY * 1.5, 1)
    Else
        C1ChartProiezioni.ChartArea.AxisY.Min = Math.Floor(ValMinY / 1.3)
    End If
    C1ChartProiezioni.ChartArea.AxisY2.Min = C1ChartProiezioni.ChartArea.AxisY.Min

    Dim ValMaxY As Single = ValMaxY0

    If idxitem = 7 Or idxitem = 8 Then
        Dim ValMaxY1 As Single
        For i = 0 To NRec - 1
            If ydata2(i) > ValMaxY1 And Not IsInfinityDbl(ydata2(i)) Then
                ValMaxY1 = ydata2(i)
            End If
        Next

        Dim ValMinY1 As Single = ydata2(0)
        For i = 1 To NRec - 1
            If ydata2(i) < ValMinY1 Then
                ValMinY1 = ydata2(i)
            End If
        Next
        Dim ValMaxY2 As Single
        For i = 0 To NRec - 1
            If ydata3(i) > ValMaxY2 And Not IsInfinityDbl(ydata3(i)) Then
                ValMaxY2 = ydata3(i)
            End If
        Next

        Dim ValMinY2 As Single = ydata3(0)
        For i = 1 To NRec - 1
            If ydata3(i) < ValMinY2 Then
                ValMinY2 = ydata3(i)
            End If
        Next

        If Math.Max(ValMaxY1, ValMaxY2) > ValMaxY0 Then
            ValMaxY = Math.Max(ValMaxY1, ValMaxY2)
        End If
    End If

    C1ChartProiezioni.ChartArea.AxisX.UnitMajor = 30
    C1ChartProiezioni.ChartArea.AxisY.UnitMajor = CInt(ValMaxY - (ValMinY / 2)) / 10
    C1ChartProiezioni.ChartArea.AxisY.UnitMinor = CInt(ValMaxY - (ValMinY / 2)) / 20
    C1ChartProiezioni.ChartArea.AxisY.Max = ValMaxY * 1.04
    C1ChartProiezioni.ChartArea.AxisY.AnnoFormat = FormatEnum.NumericManual
    C1ChartProiezioni.ChartArea.AxisY.AnnoFormatString = "#,##0.0;-#,##0.0"

    With C1ChartProiezioni.ChartGroups(1).ChartData.SeriesList
        .Clear()
        Dim ds1 As C1.Win.C1Chart.ChartDataSeries
        ds1 = .AddNewSeries()
        ds1.Label = etichetta
        ds1.X.CopyDataIn(xdata0)
        ds1.Y.CopyDataIn(ydata1)
        ds1.FillStyle.Color1 = Color.LightSteelBlue
        ds1.FillStyle.OutlineColor = Color.Black

        If idxitem = 7 Then
            Dim ds2 As C1.Win.C1Chart.ChartDataSeries
            ds2 = .AddNewSeries()
            ds2.Label = etichetta2
            ds2.X.CopyDataIn(xdata0)
            ds2.Y.CopyDataIn(ydata2)
            ds2.FillStyle.Color1 = Color.CadetBlue
            ds2.FillStyle.OutlineColor = Color.Black
        ElseIf idxitem = 8 Then
            Dim ds3 As C1.Win.C1Chart.ChartDataSeries
            ds3 = .AddNewSeries()
            ds3.Label = etichetta2
            ds3.X.CopyDataIn(xdata0)
            ds3.Y.CopyDataIn(ydata3)
            ds3.FillStyle.Color1 = Color.AliceBlue
            ds3.FillStyle.OutlineColor = Color.Black
        End If
    End With

    With C1ChartProiezioni.ChartGroups(1)
        .ChartType = Chart2DTypeEnum.Bar
        .Stacked = False
    End With

    C1ChartProiezioni.ChartGroups(1).Bar.ClusterWidth = 80 'larghezza barra
    C1ChartProiezioni.ChartLabels.LabelsCollection.Clear() 'pulisco le etichette
    C1ChartProiezioni.ChartGroups(1).ChartData.PointStylesList.Clear()
    C1ChartProiezioni.ChartArea.AxisY.Origin = 0
    C1ChartProiezioni.ChartArea.AxisY2.Max = C1ChartProiezioni.ChartArea.AxisY.Max
    C1ChartProiezioni.ChartArea.AxisY2.Visible = False
    C1ChartProiezioni.ChartArea.AxisX.Font = New Font("Tahoma", 8, FontStyle.Regular)
    C1ChartProiezioni.ChartArea.AxisY.Font = New Font("Tahoma", 8, FontStyle.Bold)
    C1ChartProiezioni.Legend.Visible = True
    C1ChartProiezioni.Legend.Style.Font = New Font("Tahoma", 9, FontStyle.Bold)
    C1ChartProiezioni.Legend.Compass = CompassEnum.South

    With C1ChartProiezioni.ChartArea.AxisX
        .ValueLabels.Clear()
        For i = 0 To NRec - 2
            .ValueLabels.Add(i, xlabels(i))
        Next
        .AnnoMethod = C1.Win.C1Chart.AnnotationMethodEnum.ValueLabels
        .TickMinor = C1.Win.C1Chart.TickMarksEnum.None
    End With


    'colorazione barre
    Dim pstyles As PointStylesCollection = C1ChartProiezioni.ChartGroups(1).ChartData.PointStylesList
    pstyles.Clear()
    Dim ps0 As PointStyle = pstyles.AddNewPointStyle
    ps0.PointIndex = indxgreen - 1
    ps0.FillStyle.Color1 = Color.LightGreen
    If idxitem = 7 Or idxitem = 8 Then
        Dim ps1 As PointStyle = pstyles.AddNewPointStyle
        ps1.PointIndex = indxgreen - 1
        ps1.SeriesIndex = 1
        ps1.FillStyle.Color1 = Color.Green
        Dim ps2 As PointStyle = pstyles.AddNewPointStyle
        ps2.PointIndex = indxgreen - 1
        ps2.SeriesIndex = 2
        ps2.FillStyle.Color1 = Color.Honeydew
    End If
    'etichette dei valori
    C1ChartProiezioni.ChartLabels.LabelsCollection.Clear()

    For i = 0 To NRec - 2
        Dim lblX0 As C1.Win.C1Chart.Label = C1ChartProiezioni.ChartLabels.LabelsCollection.AddNewLabel()
        With lblX0
            .AttachMethod = AttachMethodEnum.DataIndexY
            .AttachMethodData.GroupIndex = 1
            .AttachMethodData.SeriesIndex = 0
            .AttachMethodData.PointIndex = i
            .AttachMethodData.Y = ydata1(i)
            .Style.Font = New Font("Arial", 7.5, FontStyle.Regular)
            Select Case idxitem
                Case = 1, 2, 7, 8
                    'DMI, Latte attuale, ME Milk, MP Milk
                    .Text = Format(ydata1(i), "#,##0.0;-#,##0.0; ")
                    PolinomialCurve = False
                Case = 11
                    'Peso Vivo
                    .Text = Format(ydata1(i), "#,##0;-#,##0; ")
                Case Else
                    .Text = Format(ydata1(i), "#,##0.00;-#,##0.00; ")

            End Select
            If ydata1(i) >= 0 Then
                .Compass = LabelCompassEnum.North
            Else
                .Compass = LabelCompassEnum.South
            End If
            .Offset = 15
            .Connected = If(Math.Round(ydata1(i), 2) <> 0, True, False)
            .Style.BackColor = Color.Transparent
            .Style.ForeColor = Color.Black
            .Visible = True
        End With
    Next

    Dim HeaderText As String = trad.TradMsg("Risultati attesi") & ": "
    C1ChartProiezioni.Header.Text = HeaderText & etichetta

    If idxitem = 7 Then
        C1ChartProiezioni.Header.Text = HeaderText & trad.TradMsg("Latte permesso da ME")
    ElseIf idxitem = 8 Then
        C1ChartProiezioni.Header.Text = HeaderText & trad.TradMsg("Latte permesso da MP")
    End If

    C1ChartProiezioni.Header.Visible = True
    C1ChartProiezioni.Header.Style.Font = New Font("Tahoma", 11, FontStyle.Bold)
    C1ChartProiezioni.Header.Style.BackColor = Color.WhiteSmoke
    C1ChartProiezioni.Visible = True

    'Serie fittizia ChartGroups(0) per far vedere l'asse della Y
    C1ChartProiezioni.ChartGroups(0).ChartData.SeriesList.Clear()
    Dim ds44 As C1.Win.C1Chart.ChartDataSeries = C1ChartProiezioni.ChartGroups(0).ChartData.SeriesList.AddNewSeries()
    ds44.LegendEntry = False

    '**********************************
    If PolinomialCurve Then
        Dim Stat As New Statistiche
        Dim Grado As Integer = 6

        Stat.LS_PolynomialFitting(Grado, NRec, xDIM, ydata1)     'la condizione affinchè ci siano i risultati è Stat.Solution_Problem = False

        Dim R2 As Double = Stat.Get_R2  'restituisce il valore di R2

        'i coefficienti sono memorizzati nell'array Stat.RegrPolyCoeff.
        Dim strCoeff As String = ""
        For i = 0 To Grado
            strCoeff = strCoeff & Stat.RegrPolyCoeff(i) & " * x^" & i & vbCrLf
        Next
        strCoeff = "y = " & strCoeff

        'calcolo di valori aggiuntivi attraverso il polinomio
        Dim n As Integer = -1
        Dim pDIM() As Double
        For i = xDIM(0) To xDIM(NRec - 1)
            n += 1
            ReDim Preserve pDIM(n)
            pDIM(n) = i
        Next

        Dim k(n) As Double
        k = Stat.Calc_y_Vals(pDIM) 'calcolo dei valori corrispondenti alle x
        Dim ydata4() As Double = k

        If idxitem = 10 Then
            Dim BCScalv As Double = Stat.GetZeroDegreeCoeff

            'Condizione per avere BCS mx=5
            d = 0
            Do
                d += 1 : If d = ydata4.Length - 1 Then Exit Do
            Loop Until ydata4(d) = 5

            If d < ydata4.Length - 1 Then
                For i = d To ydata4.Length - 1
                    ydata4(i) = 5
                Next
            End If
        End If

        Dim xdata4(ydata4.Length - 1) As Double
        xdata4(0) = 0
        For i = 1 To ydata4.Length - 1
            xdata4(i) = xdata4(i - 1) + (xdata.Length - 1) / xdata4.Length
        Next

        ReDim Preserve xdata4(ydata4.Length - xDIM(0) - 5)
        Dim ds4 As C1.Win.C1Chart.ChartDataSeries
        ds4 = C1ChartProiezioni.ChartGroups(0).ChartData.SeriesList.AddNewSeries()
        ds4.X.CopyDataIn(xdata4)
        ds4.Y.CopyDataIn(ydata4)
        ds4.LineStyle.Color = Color.Red
        ds4.LineStyle.Thickness = 2
        ds4.SymbolStyle.Shape = SymbolShapeEnum.Dot
        ds4.SymbolStyle.Size = 3
        ds4.SymbolStyle.Color = Color.Red
        ds4.Label = trad.TradMsg("Andamento atteso")
        C1ChartProiezioni.ChartGroups(0).ChartType = Chart2DTypeEnum.XYPlot
    End If


    ' Enable tooltip
    DataSeriesTooltipText1 = "{#YVAL}"

    C1ChartProiezioni.ToolTip.PlotElement = PlotElementEnum.Points
    C1ChartProiezioni.ToolTip.Enabled = True

End Sub[/code]
And here is the current FlexChart version with the issues described above:
[code]Private Sub CaricaFlexChartProiezioni()
Me.Size = New Size(1400, 620)
Me.Location = New System.Drawing.Point(160, 165)
Dim i, d As Integer
    FlexChartProiezioni.Series.Clear()

    FlexChartProiezioni.BackColor = Color.WhiteSmoke

    FlexChartProiezioni.AxisY.Title = etichetta & If(um <> "", " (" & um & ")", "")
    FlexChartProiezioni.AxisX.Title = trad.TradMsg("Giorni di lattazione")

    Dim NRec As Integer = arrayserie.Length - 2
    Dim xDIM() As Double
    Dim xdata() As Double
    Dim xdata0() As Double
    Dim xlabels() As String
    Dim ydata1() As Double
    Dim ydata2() As Double
    Dim ydata3() As Double
    Dim PolinomialCurve As Boolean = True

    ReDim xDIM(NRec - 1)
    ReDim xdata(NRec - 1) : ReDim xdata0(NRec - 2)
    ReDim xlabels(NRec - 1)
    ReDim ydata1(NRec - 1)
    ReDim ydata2(NRec - 1)
    ReDim ydata3(NRec - 1)

    For i = 0 To NRec - 1
        xdata(i) = i
        If i < NRec - 1 Then xdata0(i) = i
        xDIM(i) = Scheda.Dati(SchedaSelezionata).Raz.projDIM(i + 1)
        xlabels(i) = Scheda.Dati(SchedaSelezionata).Raz.projDIM(i + 1)
        ydata1(i) = arrayserie(i + 1)
        If idxitem = 7 Then
            ydata2(i) = Math.Round(arrayserie1(i + 1), 1)
        ElseIf idxitem = 8 Then
            ydata3(i) = Math.Round(arrayserie2(i + 1), 1)
        End If
    Next

    Dim ValMaxY0 As Single
    For i = 0 To NRec - 1
        If ydata1(i) > ValMaxY0 And Not IsInfinityDbl(ydata1(i)) Then
            ValMaxY0 = ydata1(i)
        End If
    Next

    Dim ValMinY As Single = ydata1(0)
    For i = 1 To NRec - 1
        If ydata1(i) < ValMinY Then
            ValMinY = ydata1(i)
        End If
    Next

    If ValMinY < 0 Then
        FlexChartProiezioni.AxisY.Min = Math.Round(ValMinY * 1.5, 1)
    Else
        FlexChartProiezioni.AxisY.Min = Math.Floor(ValMinY / 1.3)
    End If

    Dim ValMaxY As Single = ValMaxY0

    If idxitem = 7 Or idxitem = 8 Then
        Dim ValMaxY1 As Single
        For i = 0 To NRec - 1
            If ydata2(i) > ValMaxY1 And Not IsInfinityDbl(ydata2(i)) Then
                ValMaxY1 = ydata2(i)
            End If
        Next

        Dim ValMinY1 As Single = ydata2(0)
        For i = 1 To NRec - 1
            If ydata2(i) < ValMinY1 Then
                ValMinY1 = ydata2(i)
            End If
        Next
        Dim ValMaxY2 As Single
        For i = 0 To NRec - 1
            If ydata3(i) > ValMaxY2 And Not IsInfinityDbl(ydata3(i)) Then
                ValMaxY2 = ydata3(i)
            End If
        Next

        Dim ValMinY2 As Single = ydata3(0)
        For i = 1 To NRec - 1
            If ydata3(i) < ValMinY2 Then
                ValMinY2 = ydata3(i)
            End If
        Next

        If Math.Max(ValMaxY1, ValMaxY2) > ValMaxY0 Then
            ValMaxY = Math.Max(ValMaxY1, ValMaxY2)
        End If
    End If

    FlexChartProiezioni.AxisY.Max = ValMaxY * 1.04


    ' create a datatable
    Dim dt As New DataTable("Curva1")

    ' add columns to the datatable
    dt.Columns.Add("xlabels", GetType(String))
    dt.Columns.Add(etichetta, GetType(Double))
    If idxitem = 7 OrElse idxitem = 8 Then dt.Columns.Add(etichetta2, GetType(Double))


    ' add rows to the datatable
    If idxitem = 7 Then
        For i = 0 To xdata.Length - 1
            dt.Rows.Add(xlabels(i), ydata1(i), ydata2(i))
        Next
    ElseIf idxitem = 8 Then
        For i = 0 To xdata.Length - 1
            dt.Rows.Add(xlabels(i), ydata1(i), ydata3(i))
        Next
    Else
        For i = 0 To xdata.Length - 1
            dt.Rows.Add(xlabels(i), ydata1(i))
        Next
    End If


    ' specify the datasource for the chart
    FlexChartProiezioni.DataSource = dt
    ' bind the X-axis
    FlexChartProiezioni.BindingX = "xlabels"

    FlexChartProiezioni.Series.Clear()
    Dim ds1 As New C1.Win.Chart.Series
    Dim ds2 As C1.Win.Chart.Series
    Dim ds3 As C1.Win.Chart.Series
    FlexChartProiezioni.Series.Add(ds1)
    If idxitem = 7 Then
        ds2 = New C1.Win.Chart.Series
        FlexChartProiezioni.Series.Add(ds2)
    End If
    If idxitem = 8 Then
        ds3 = New C1.Win.Chart.Series
        FlexChartProiezioni.Series.Add(ds3)
    End If

    ds1.Binding = etichetta
    ds1.Name = etichetta
    ds1.ChartType = C1.Chart.ChartType.Column
    ds1.Style.FillColor = Color.LightSteelBlue
    ds1.Style.StrokeColor = Color.Black
    ds1.DataLabel = New C1.Win.Chart.DataLabel()
    With ds1.DataLabel
        Try
            Select Case idxitem
                Case = 1, 2, 7, 8
                    'DMI, Latte attuale, ME Milk, MP Milk
                    .Content = "{y:F1}" ', "#,##0.0;-#,##0.0; " 'Mostra il valore della Y
                    PolinomialCurve = False
                Case = 11
                    'Peso Vivo
                    .Content = "{y:F1}"
                Case Else
                    .Content = "{y:F1}"
            End Select
        Catch ex As Exception
        End Try

        .Position = C1.Chart.LabelPosition.Top   ' Posizione sopra la barra
        .Border = False
        .ConnectingLine = True
        .Offset = 15
        .Style.Font = New Font("Arial", 7.5, FontStyle.Regular)
        .Style.FillColor = Color.Black
    End With

    If idxitem = 7 Then
        ds2.Binding = etichetta2
        ds2.Name = etichetta
        ds2.ChartType = C1.Chart.ChartType.Column
        ds2.Style.FillColor = Color.CadetBlue
        ds2.Style.StrokeColor = Color.Black
    ElseIf idxitem = 8 Then
        ds3.Binding = etichetta2
        ds3.Name = etichetta
        ds3.ChartType = C1.Chart.ChartType.Column
        ds3.Style.FillColor = Color.AliceBlue
        ds3.Style.StrokeColor = Color.Black
    End If

    FlexChartProiezioni.Options.ClusterSize.Value = 80 'larghezza barra
    FlexChartProiezioni.AxisX.Style.Font = New Font("Tahoma", 8, FontStyle.Regular)
    FlexChartProiezioni.AxisY.Style.Font = New Font("Tahoma", 8, FontStyle.Bold)
    FlexChartProiezioni.Legend.Style.Font = New Font("Tahoma", 9, FontStyle.Bold)
    FlexChartProiezioni.Legend.Position = C1.Chart.Position.Bottom


    'colorazione barre
    'Dim s As New C1.Win.Chart.Series()
    's.Name = "Serie1"
    's.Binding = "yval"
    'FlexChartProiezioni.Series.Add(s)
    'Dim pstyles As PointStylesCollection = FlexChartProiezioni.ChartType.
    'pstyles.Clear()
    'Dim ps0 As PointStyle = pstyles.AddNewPointStyle
    'ps0.PointIndex = indxgreen - 1
    'ps0.FillStyle.Color1 = Color.LightGreen
    'If idxitem = 7 Or idxitem = 8 Then
    '    Dim ps1 As PointStyle = pstyles.AddNewPointStyle
    '    ps1.PointIndex = indxgreen - 1
    '    ps1.SeriesIndex = 1
    '    ps1.FillStyle.Color1 = Color.Green
    '    Dim ps2 As PointStyle = pstyles.AddNewPointStyle
    '    ps2.PointIndex = indxgreen - 1
    '    ps2.SeriesIndex = 2
    '    ps2.FillStyle.Color1 = Color.Honeydew
    'End If


    Dim HeaderText As String = trad.TradMsg("Risultati attesi") & ": "
    FlexChartProiezioni.Header.Content = HeaderText & etichetta

    If idxitem = 7 Then
        FlexChartProiezioni.Header.Content = HeaderText & trad.TradMsg("Latte permesso da ME")
    ElseIf idxitem = 8 Then
        FlexChartProiezioni.Header.Content = HeaderText & trad.TradMsg("Latte permesso da MP")
    End If

    FlexChartProiezioni.Header.Style.Font = New Font("Tahoma", 11, FontStyle.Bold)
    FlexChartProiezioni.Header.Style.StrokeColor = Color.WhiteSmoke
    FlexChartProiezioni.Visible = True


    '**********************************
    If PolinomialCurve Then
        Dim Stat As New Statistiche
        Dim Grado As Integer = 6

        Stat.LS_PolynomialFitting(Grado, NRec, xDIM, ydata1)     'la condizione affinchè ci siano i risultati è Stat.Solution_Problem = False

        Dim R2 As Double = Stat.Get_R2  'restituisce il valore di R2

        'i coefficienti sono memorizzati nell'array Stat.RegrPolyCoeff.
        Dim strCoeff As String = ""
        For i = 0 To Grado
            strCoeff = strCoeff & Stat.RegrPolyCoeff(i) & " * x^" & i & vbCrLf
        Next
        strCoeff = "y = " & strCoeff

        'calcolo di valori aggiuntivi attraverso il polinomio
        Dim n As Integer = -1
        Dim pDIM() As Double
        For i = xDIM(0) To xDIM(NRec - 1)
            n += 1
            ReDim Preserve pDIM(n)
            pDIM(n) = i
        Next

        Dim k(n) As Double
        k = Stat.Calc_y_Vals(pDIM) 'calcolo dei valori corrispondenti alle x
        Dim ydata4() As Double = k

        If idxitem = 10 Then
            Dim BCScalv As Double = Stat.GetZeroDegreeCoeff

            'Condizione per avere BCS mx=5
            d = 0
            Do
                d += 1 : If d = ydata4.Length - 1 Then Exit Do
            Loop Until ydata4(d) = 5

            If d < ydata4.Length - 1 Then
                For i = d To ydata4.Length - 1
                    ydata4(i) = 5
                Next
            End If
        End If

        Dim xdata4(ydata4.Length - 1) As Double
        xdata4(0) = 0

        For i = 1 To ydata4.Length - 1
            xdata4(i) = xdata4(i - 1) + (xdata.Length - 1) / xdata4.Length
        Next

        ReDim Preserve xdata4(ydata4.Length - xDIM(0) - 5)
        Dim ds4 As New C1.Win.Chart.Series
        ds4.ChartType = C1.Chart.ChartType.SplineSymbols
        For i = 0 To xdata4.Length - 1
            dt.Rows.Add(xdata4(i), ydata4(i))
        Next
        FlexChartProiezioni.Series.Add(ds4)
        ds4.Style.FillColor = Color.Red
        ds4.Style.StrokeWidth = 2
        ds4.Style.LinePattern = SymbolShapeEnum.Dot
        ds4.SymbolSize = 3
        ds4.SymbolStyle.FillColor = Color.Red
        ds4.Name = trad.TradMsg("Andamento atteso")

    End If


    ' Enable tooltip
    FlexChartProiezioni.ToolTip.Active = False
    FlexChartProiezioni.Dock = DockStyle.Fill

End Sub[/code]
Any suggestions or examples would be greatly appreciated.
Thanks!