Posted 8 June 2018, 4:27 am EST
- Updated 4 October 2022, 2:33 am EST
Hi Steven,
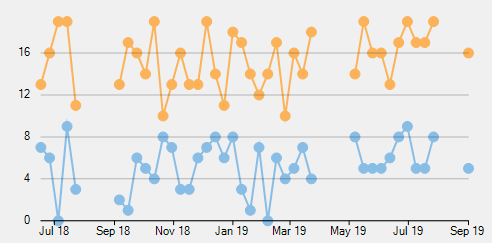
FlexChart also have ability to show “Holes” in a line series. But unlike C1Chart, FlexChart uses a more generic concept for this. Since holes represent the absence of data at a specific point, therefore a null in data (or values like double.NaN/float.NaN) are treated as holes instead of a specified value(as was in the case of C1Chart).
Also, you’ll need to ensure that the InterpolateNulls option has been set to false for the data holes to be visible. Please refer to the attached sample for an example.
Regards,
Ankit
HolesInSeries_FC.zip