
Posted 15 July 2025, 9:50 am EST - Updated 15 July 2025, 9:55 am EST
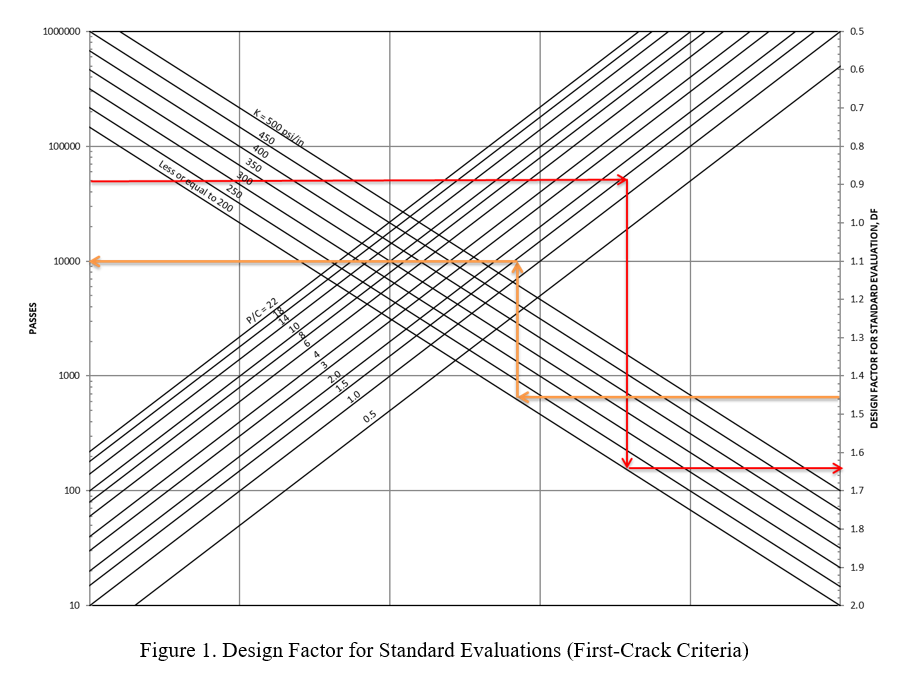
I am trying to create a rather complex chart based on a design by engineers. Attachment 1 shows how the final chart should look. Attachment 2 shows a preliminary version with details about the axes.
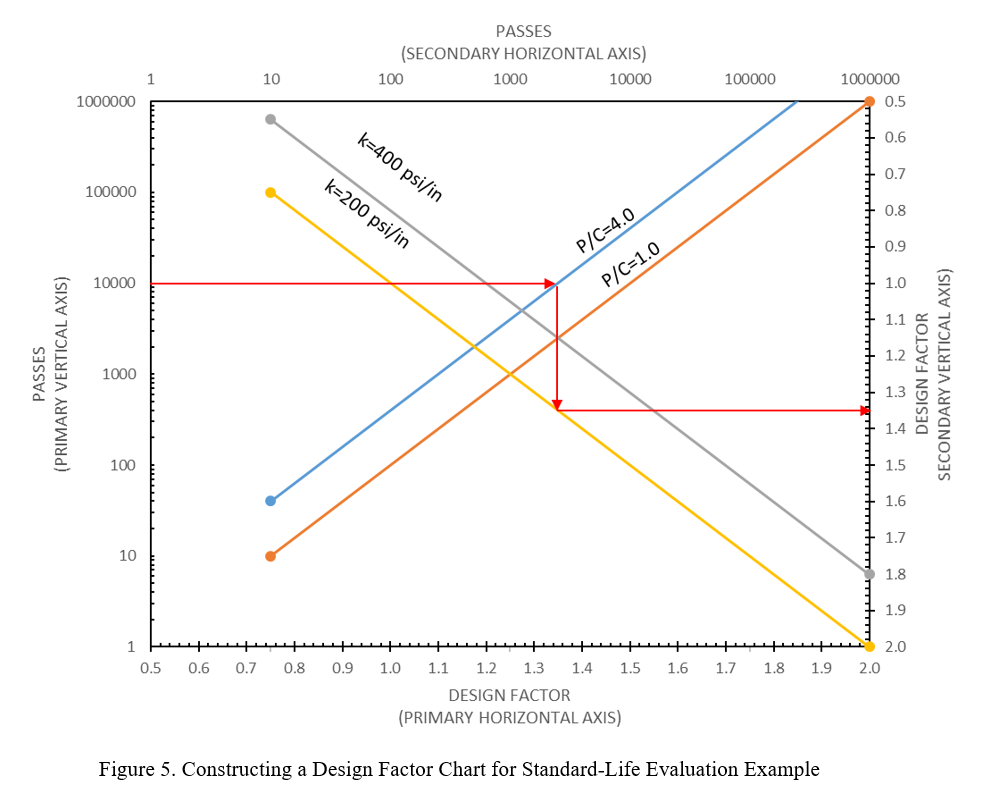
The chart is a fairly simple line chart except that it requires two sets of series, plotted on different axes: the first series set is plotted on the standard X and Y axes and the second series set is plotted on a second X axis (which is vertical on the right) and a secondary Y axis (which is horizontal on the top).
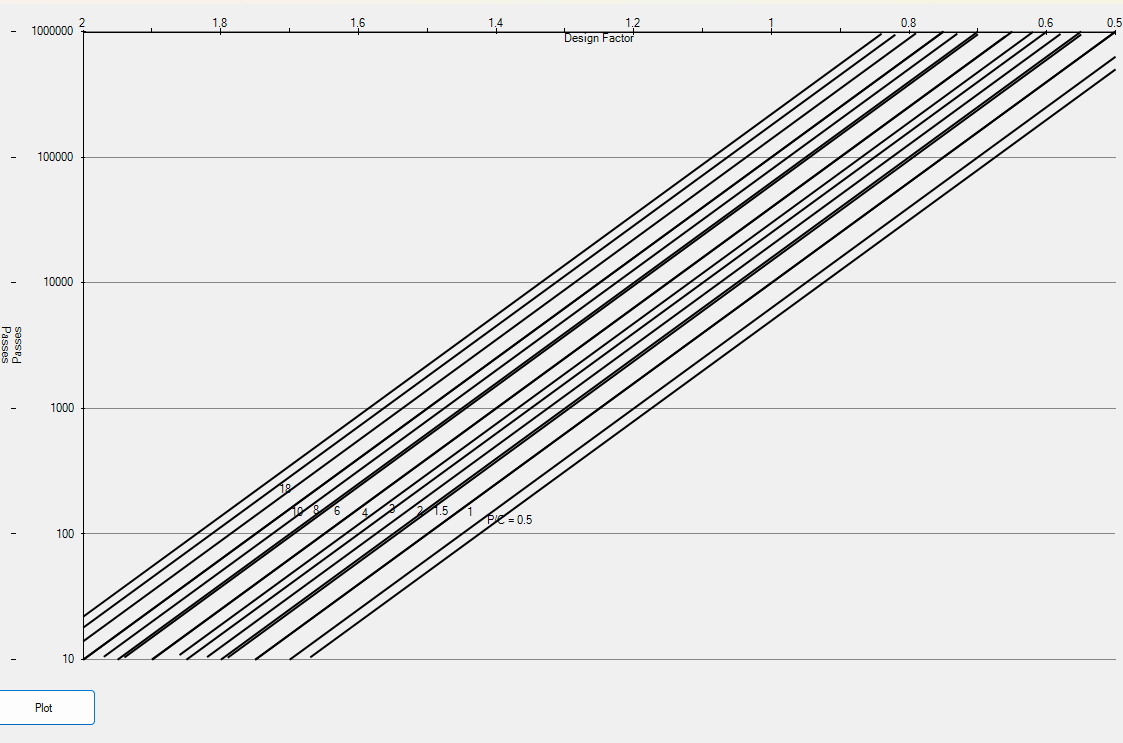
The first series, if I do it alone, plots just fine. When I add the second series with new Axes I create and position, the axes do not show up where I position them (right and top) but instead show up top and left and the additional series doesn’t plot at all. Attachment 3 below shows how it turns out.
This seems like it should work, but is not working at all. Sample code attached. I have spent two days trying different things to make this work, with no success. Please help!
Regards,
Bob Reinke


