Posted 24 April 2020, 2:29 am EST
Hi,
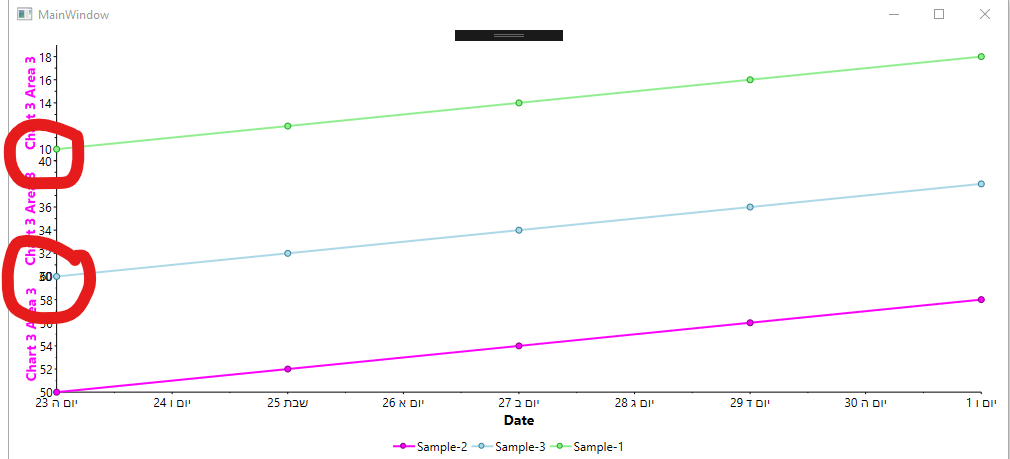
To add gap between plots, you can add intermediate PlotAreas by specifying the alternate PlotAreaIndex for the added Y-Axes as follows:
        If chk1.IsChecked Then PlotChart("Y0", chk.Content.ToString(), m_dsList(0), [b]0[/b])
        If chk2.IsChecked Then PlotChart("Y1", chk.Content.ToString(), m_dsList(1), [b]2[/b])
        If chk3.IsChecked Then PlotChart("Y2", chk.Content.ToString(), m_dsList(2), [b]4[/b])
Also, you can specify the Height of the gaps/plot-areas by using the PlotAreasRowDefinitions as follows:
```
chart1.View.PlotAreaRowDefinitions.Add(New PlotAreaRowDefinition() With {.Height = New GridLength(1, GridUnitType.Star)})
chart1.View.PlotAreaRowDefinitions.Add(New PlotAreaRowDefinition() With {.Height = New GridLength(20, GridUnitType.Pixel)})
Please refer to the attached modified sample for the same.

[zip filename="GapBetweenPlots.zip"]https://gccontent.blob.core.windows.net/forum-uploads/file-a934f98e-0e1b-474f-a6a5-58db0a2f160a.zip[/zip]

Also, just to inform you, since C1Chart is now in maintenance (https://www.grapecity.com/forums/wpf-edition/c1chart-in-maintenance-mod) so, you may consider our new and more efficient charting control named [b]FlexChart[/b] if there is no specific concern about using C1Chart. Just in case, for multiple plots in FlexChart you may refer to the following: https://www.grapecity.com/componentone/docs/wpf/online-flexchart/Multiple-Plot-Areas.html

Regards,
Basant