
Posted 3 August 2018, 9:48 am EST - Updated 4 October 2022, 9:17 am EST
Background
I need to customize the legend of the C1Chart. The customer would like a check box to appear adjacent to each item. He would like to be able to turn the associated data series on and off.
Current Approach
I have tried customizing the legend’s ItemTemplate.
<c1:C1ChartLegend.ItemTemplate>
    <DataTemplate>
        <CheckBox Content="{Binding}" />
    </DataTemplate>
</c1:C1ChartLegend.ItemTemplate>
That results in the following:
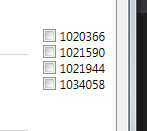
I’m assuming that the “{Binding}” on the Checkbox’s Content property is displaying the ToString() method of the item being bound.
Now, I need to display the color/dash/thickness of the associated data series. I am using XYDataSeries.
Questions
Is there a better way to accomplish this? Better than providing an ItemTemplate?
What is the type of the object being bound in the ItemTemplate? Is it the associated Series? Is it the Label of the Series?


