
Charting
The Charting sample provides an option to choose from various chart types and a button to display the selected chart in a Viewer control.
Sample Location
Visual Basic.NET
https://github.com/activereports/Samples19/tree/main/API/Section/Charting/VB.NET
C#
https://github.com/activereports/Samples19/tree/main/API/Section/Charting/C#
Details
Chart type combobox
Select from the following ChartType options.
- 2D Bar Chart - Use this chart to compare values of items across categories.
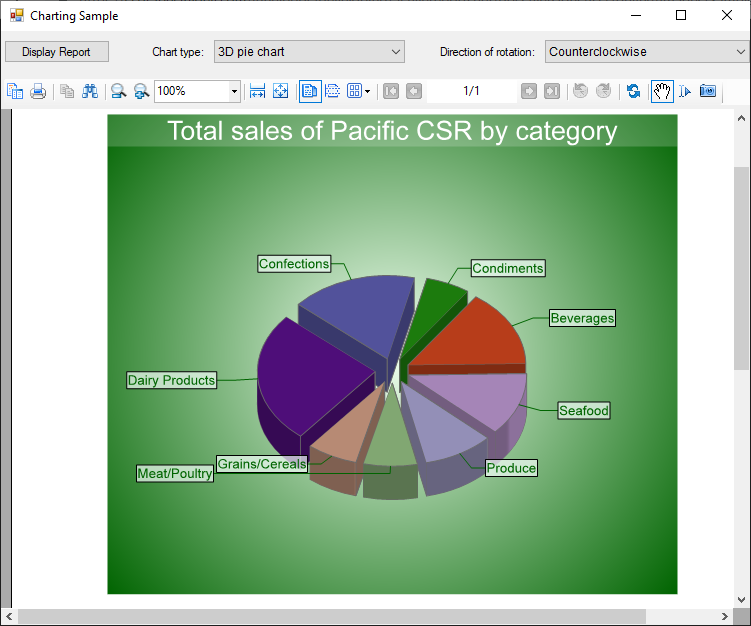
- 3D Pie Chart - Use this chart to display data in 3D format to depict how percentage of each data item contributes to a total percentage. Selecting this ChartType provides an option to set the Direction of rotation of 3D Pie chart to Clockwise or Counterclockwise.
- 3D Bar Chart - Use this chart to compare values of items across categories and to display the data in a 3D format.
- Finance Chart -Use this chart to display the stock information using High, Low, Open and Close values. The size of the wick line is determined by the High and Low values, while the size of the bar is determined by the Open and Close values.
- Stacked Area Chart - Use this chart to demonstrate how each value contributes to the total.
Report Display button
Click this button to display the selected chart type in a Viewer control.
type=note
Note: To run rpt2DBar, rpt3DPie and rpt3DBar report, you must have access to the Nwind database. The NWIND.db file can be downloaded from GitHub: ..\Samples19\Data\NWIND.db.
ViewerForm
The ViewerForm contains the Viewer control, with the Dock property set to Fill. This enables the viewer to automatically resize along with the form. Right-click the form and select View Code to see the code used to run the report and display it in the viewer.
rpt2DBar report
Displays bar chart on a report. Retrieves the data to be displayed in a chart from Orders table in Nwind.db database. Settings for chart data source can be done using the Chart Data Source dialog.
rpt3DBar report
Displays 3D bar chart on a report. Retrieves the data to be displayed in a chart from Orders table in Nwind.db database. Generates a DataSet for the chart in ReportStart event and sets it in DataSource property of Chart control.
rpt3DPie report
Displays 3D pie chart on a report. Retrieves the data to be displayed in a chart from each of the Employees, Categories, Products, Orders, Order Details tables in Nwind.db database. Generates a DataTable for the chart in a ReportStart event and sets it in DataSource property of Chart control. Rotational direction of 3D pie chart can be set to Clockwise or Counterclockwise.
rptCandle report
Displays candle chart on a report. Chart data is set at design time using DataPoint Collection Editor. DataSource property is not used for this chart.
rptStackedArea report
Displays stacked area chart on a report. Chart data is set at design time using DataPoint Collection Editor. DataSource property is not used for this chart.