
What's New
Since the last version of ActiveReports, we have introduced several new features and implemented many key improvements to enhance performance, usability, and functionality. The key highlights for this service pack release are:
v.19.2
Export Hidden Text in Section Reports (TXT Format)
A new PreserveHiddenText property of the Text export allows you to include hidden text from your section reports when exporting to the Plain Text (TXT) format.
Auto Detect Row Separator in Connection String Builder (CSV Data Source)
A new Auto Detect option as a row separator value in the connection string builder of the CSV data provider makes it possible to read csv data regardless of the line ending style (CRLF or LF). Selecting this property removes RowSeparator from the connection string of the CSV data provider. As a result, the csv data is read correctly regardless of the line ending style (CRLF or LF).
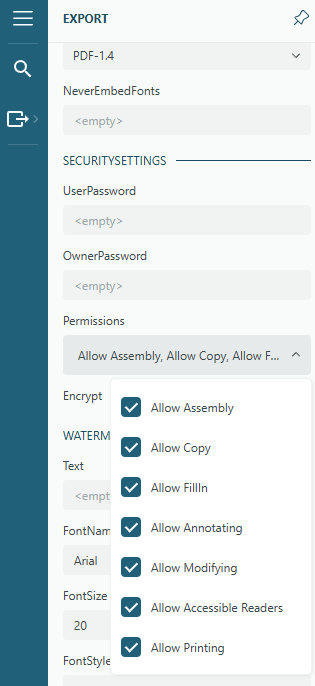
Permissions in PDF Export (Web Viewers)
A new Permissions option is now part of the PDF Export panel in all Web Viewers - Js Viewer, Blazor Viewer, and ASP.NET WebViewer. The selected permissions from this option are applied if the Encrypt setting is set to True.
Predefined Export Settings | Js Viewer API | Blazor Viewer API
Disable Editing in WebDesigner
With a new allowInLineEditing property, you can disable the in-line editor for Page, RDLX and Dashboard reports in the WebDesigner. When the allowInLineEditing property is set to False, you cannot edit text directly in the Table, Tablix, TextBox, CheckBox, and InputField controls by double-clicking it in the WebDesigner.