
- Introduction
- Report Readers
-
Report Authors
- Standalone Designer
- WebDesigner
- Report Types
- Report Controls
- Report Wizard
- Data Binding
- Design Reports
- DevOps
- Developers
- Samples
- Troubleshooting
Icon Set
The Icon Set data visualization allows you to use arguments to select an image from an image strip and display it either as a BackgroundImage, or as a Value. You can use the standard image strips included with ActiveReports, or create custom image strips.
The Icon Set Data Visualizer is supported in the Image report control Value property, and also in the TextBox, CheckBox, Shape, and Container report controls' BackgroundImage - Value property.
To open the dialog, drop down the BackgroundImage property of TextBox, CheckBox, Shape, and Container report controls, or the Value property of Image report control, and select <Data Visualizer...>. To build the data visualizer expression, select the appropriate values for each of the options in the dialog.
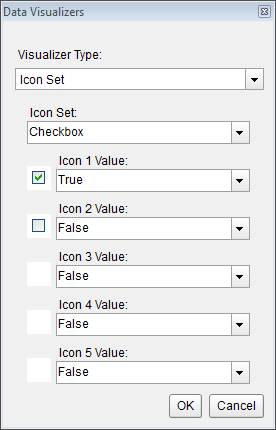
Parameters
- Icon Set. This designates the name of the icon set to use.
- Icon 1 Value. A Boolean expression that, if it evaluates to True, renders this icon from the strip.
- Icon 2 Value. A Boolean expression that, if it evaluates to True, renders this icon from the strip.
- Icon 3 Value. A Boolean expression that, if it evaluates to True, renders this icon from the strip.
- Icon 4 Value. A Boolean expression that, if it evaluates to True, renders this icon from the strip.
- Icon 5 Value. A Boolean expression that, if it evaluates to True, renders this icon from the strip.
You can use static values or any expression that evaluates to a Boolean value. For icon sets with fewer than five icons, set the unused values to False.
Standard Image Strips
| Name | Image |
|---|---|
| Checkbox |  |
| 3TrafficLights |  |
| Arrows |  |
| Blank |  |
| Flags |  |
| GrayArrows |  |
| Quarters |  |
| Ratings |  |
| RedToBlack |  |
| Signs |  |
| Symbols1 |  |
| Symbols2 |  |
| TrafficLights |  |
type=note
Note: When using icon sets, you must set the Source property to Database, otherwise it may throw exception.
Syntax
=IconSet("Flags", False, True, False, False, False)
Usage
Following the Icon Set argument, there are five Boolean arguments. The first argument to evaluate to True displays the corresponding image. Use data expressions that evaluate to a Boolean value to replace the literal values in the code above.
Example
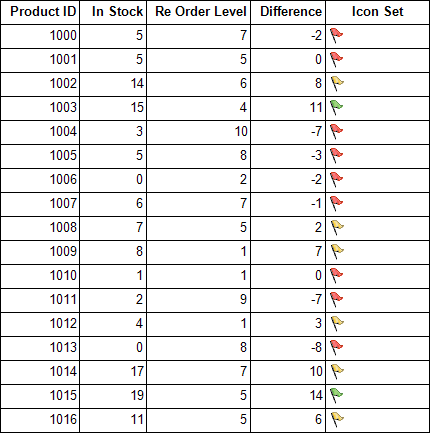
This expression displays the first symbol (the green flag) on each row in which the Difference exceeds 10, displays the second symbol (the yellow flag) on each row in which the quantity is greater than 0, and displays the third symbol (the red flag) on each row in which the quantity is equal to or below 0. Notice that we provide literal False values in the fourth and fifth arguments, which have no images in this strip.
=IconSet("Flags",Fields!TaxPercent.Value > 10,Fields!TaxPercent.Value > 0,Fields!TaxPercent.Value <= 0,False,False)
In several of the included image strips, the last spots are empty. When using the Checkbox, 3TrafficLights, Flags, RedToBlack, Signs, Symbols1, Symbols2, or TrafficLights image strip, it generally makes sense to set the Boolean values for all of the unused icon spaces to False.
Custom Image Strips
The Blank image strip is included so that you can customize it. Custom image strips must conform to the following rules.
- The format must be of a type that is handled by the .NET framework.
- The size of the strip must be 120 x 24 pixels.
- Each image must be 24 x 24 pixels in size.
- There must be no more than five images in the strip.
- If there are fewer than five images in the strip, there must be blank spaces in the image to fill in.
Types of Custom Images
Here is the syntax for various types of custom images, followed by examples of each.
=IconSet(location of image strip, condition#1, condition#2, condition#3, condition#4, condition#5)
=IconSet("C:\Images\customstrip.bmp", 4 > 9, 5 > 9, 10 > 9, False, False)
=IconSet("http://mysite.com/images/customstrip.gif", 4 > 9, 5 > 9, 10 > 9, False, False)
=IconSet("res:[Assembly Name]/Resource name", condition#1, condition#2, condition#3, condition#4, condition#5)
=IconSet("res:ReportAssembly, Version=1.1.1.1./ReportAssembly.Resources.Images.CustomImage.png", 4 > 9, 5 > 9, 10 > 9, False, False)
=IconSet("embeddedImage:ImageName", condition#1, condition#2, condition#3, condition#4, condition#5)
=IconSet("embeddedImage:Grades", Fields!Score.Value >=90, Fields!Score.Value >=80, Fields!Score.Value >=70, Fields!Score.Value >=60, True)
=IconSet("theme:ThemeImageName", condition#1, condition#2, condition#3, condition#4, condition#5)
=IconSet("theme:Grades", Fields!Score.Value >=90, Fields!Score.Value >=80, Fields!Score.Value >=70, Fields!Score.Value >=60, True)