
- Introduction
- Report Readers
-
Report Authors
- Standalone Designer
- WebDesigner
- Report Types
- Report Controls
- Report Wizard
- Data Binding
-
Design Reports
-
Design Page/RDLX Reports
- Layout
- Report Dialog
- Master Report (RDLX Report)
- Layers
- Expressions
- Data Visualizers
- Filters
- Groups
- Interactivity
- Scripts
- Report Appearance
-
Tutorials: Report Controls in Page/RDLX Reports
- TableofContent Control for Navigation
- BandedList Data Region for Free-form Bands
- Bullet Control to Visualize Sales against Target
- CheckBox Control
- OverflowPlaceholder Control for Columnar Reports
- InputField Control for Editable PDFs
- Line Control for Freehand Forms
- List Control for Hierarchical Relationships
- Table Data Region for a Tabular Report
- Shape Control for Enhanced Report Appearance
- Image Control
- Container Control for Enhanced Report Appearance
- FormattedText Control for Mail Merge
- Subreport Control for a Master-Detail Report
- Sparkline Control
- Tablix Data Region
- TextBox Control
- Map Data Region
- Tutorials: Page/RDLX Report Scenarios
- Design Section Reports
-
Design Page/RDLX Reports
- DevOps
- Developers
- Samples
- Troubleshooting
Bullet Control to Visualize Sales against Target
Let us create a report that shows the sales relative to a target sale amount for each customer. We will use the Bullet control inside a Table data region to create this report. The report connects to the 'Sale' table from the 'Reels.db' data source available on GitHub.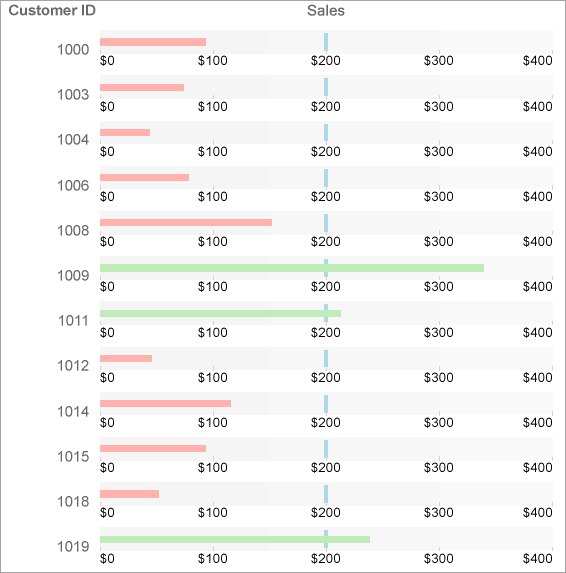
Create a Report
In the ActiveReports Designer, create a new Page or an RDLX report.
type=note
If you are creating a new report in the Visual Studio Integrated Designer, see Quick Start.
Bind Report to Data
As you create a new report, you can configure the report data connection in the Report Wizard. You can also access the Report Data Source dialog by right-clicking the Data Sources node in the Report Explorer and then selecting the Add Data Source option. See SQLite for details.
On the Choose Data Source Type screen of the wizard, select SQLite and click Next.
To specify the DataBase Path, click the Browse button and navigate to the desired file on your system. For example, you can connect to the Reels.db sample data source which can be downloaded from GitHub.
Click Test Connection to test the connection.
Then click the Next option and configure the dataset by adding a valid query.
Enter an SQL query like the following into the Query text box:
SELECT * FROM Sale ORDER BY Customer ASC
See Query Builder in Microsoft SQL Client and OLEDB Providers for more information on building SQL queries.Click Finish to successfully add the report with the SQLite data source.
Design Report Layout
Drag and drop the Table data region onto the design area of the Report Designer.
Drag a Bullet control onto the Details row of the table and in the Properties panel, set its Value property to
=Fields!SalesAmount.ValueThis Value property is used to define the key measure displayed on the graph.
With the Bullet control selected on the design area:
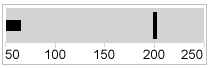
- Set its Target Value property to 200. This property defines a target for the Value to be compared to.
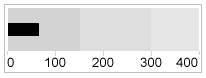
- Set its Best Value property to 400 and the Worst Value property to 0. The Best Value and Worst Value properties define the value range on the graph.
- You can also optionally encode the segments on the graph as qualitative ranges indicating bad, satisfactory, and good sections.
- The Range1Boundary property defines a value for the bad/satisfactory boundary on the graph. Set this property to 150.
- The Range2Boundary property defines a value for the satisfactory/good boundary on the graph. Set this property to 300.
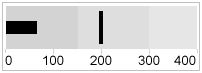
- You can also optionally define the Interval property for the graph value range. So, set this property to 100.
- Set its Target Value property to 200. This property defines a target for the Value to be compared to.
Specify the TargetShape as 'Line'.
Specify the position of TickMarks as 'Inside'.
Modify the appearance of the report. You can customize the appearance of bullets as follows:
Set the TargetStyle and the TickStyle properties.
Specify color patterns based on the relative value of the key measure. For example, set the expression like the following in the ValueColor property to show the color pattern based on the value of [SalesAmount]:
=iif(Fields!SalesAmount.Value >= 200, "#BFECB8", "#FFB1AE")