
- Introduction
- Report Readers
-
Report Authors
- Standalone Designer
- WebDesigner
- Report Types
-
Report Controls
-
Report Controls in Page/RDLX Report
- BandedList
- Barcode
- Bullet
-
Chart
- Chart Wizard
- Chart Smart Panels and Adorners
-
Plots
- Column and Bar Charts
- Area Chart
- Line Chart
- Pie and Doughnut Charts
- Scatter and Bubble Charts
- Radar Scatter and Radar Bubble Charts
- Radar Line Chart
- Radar Area Chart
- Spiral Chart
- Polar Chart
- Gantt Chart
- Funnel and Pyramid Charts
- Candlestick Chart
- High Low Close Chart
- High Low Open Close Chart
- Range Charts
- Gauge Chart
- Axes
- Legends
- Customize Chart Appearance
- Trendlines
- Classic Chart
- CheckBox
- Container
- ContentPlaceHolder (RDLX Master Report)
- FormattedText
- Image
- InputField
- Line
- List
- Map
- Matrix
- Overflow Placeholder (Page report only)
- Shape
- Sparkline
- Subreport
- Table
- Table of Contents
- Tablix
- TextBox
- Report Controls in Section Report
-
Report Controls in Page/RDLX Report
- Report Wizard
- Data Binding
- Design Reports
- DevOps
- Developers
- Samples
- Troubleshooting
Radar Area Chart
The Radar area plot arranges categories on the circumference of a circle and connects the corresponding points with straight lines. The data values are plotted radially and are connected with straight lines resulting in a polygon shape. Radar Area plots are generally used to display ordinal variables across different category ranges.
Radar Area Plot with Single Value
A single value radar area chart shows measurements of one variable.
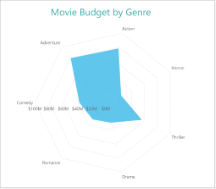
Radar Area Plot with Single Value
Radar Area Plot with Multiple Values
A multiple values radar chart lets you split data values into subcategories for finer analysis. The Create Radar Area Chart with Multiple Values walkthrough showcases the average movie budget in a country for different movie genres.
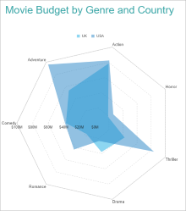
Radar Area Plot with Multiple Values