
Configuring Tablix
General
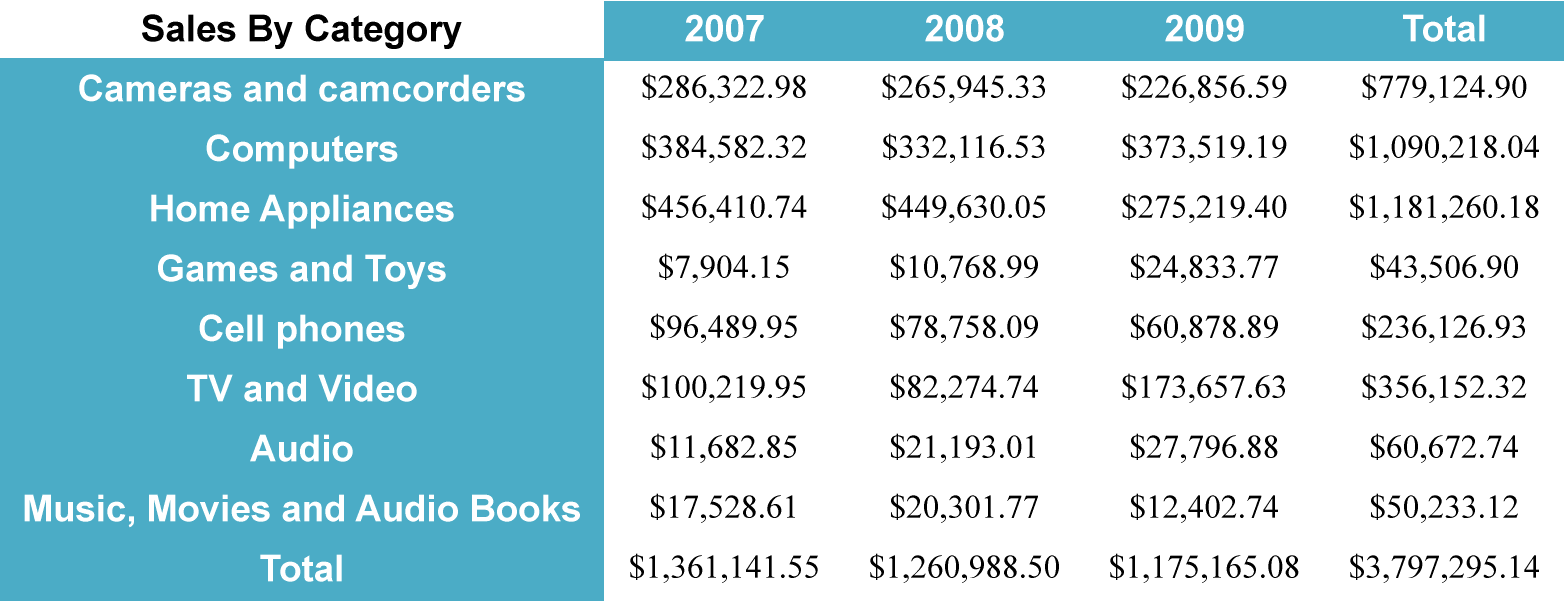
A Pivot Table, also known as a Tablix, is a data display control that organizes and summarizes your data records into groups. It arranges these groups’ unique values in two directions: horizontal (Column Groups) and vertical (Row Groups). At the intersection of a Row and Column Group, one or more summary values are displayed, providing a clear and concise representation of the data.
Below is an example of a pivot table displaying sales data in a report output:
The report wizard guides you through the process of configuring a pivot table with a series of intuitive steps, as described below.
Choosing Tablix Query and Field
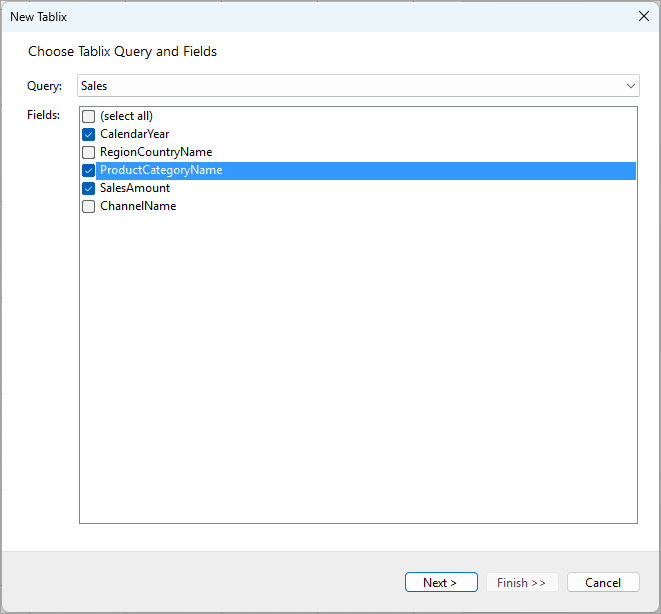
In the Query drop-down, you can select one of the report's available data queries. For detailed information on setting up queries, see the Configuring Data Queries in Report Wizard and Configuring Data Set Properties documentation pages.
The Fields list displays all the fields retrieved by the selected query. To display all these fields in the tablix, click the (select all) checkbox. Alternatively, you can select only a subset of fields to be displayed in the Tablix, as shown in the screenshot above. Click Next > to proceed to the next step.
Configuring Tablix Row Groupings
The Confgure Tablix Row Groupings step helps you configure the row groupings for your Tablix. Grouping allows you to organize your data into meaningful sections based on the selected field. The settings in this dialog allow you to control how rows are grouped and displayed.
General Settings
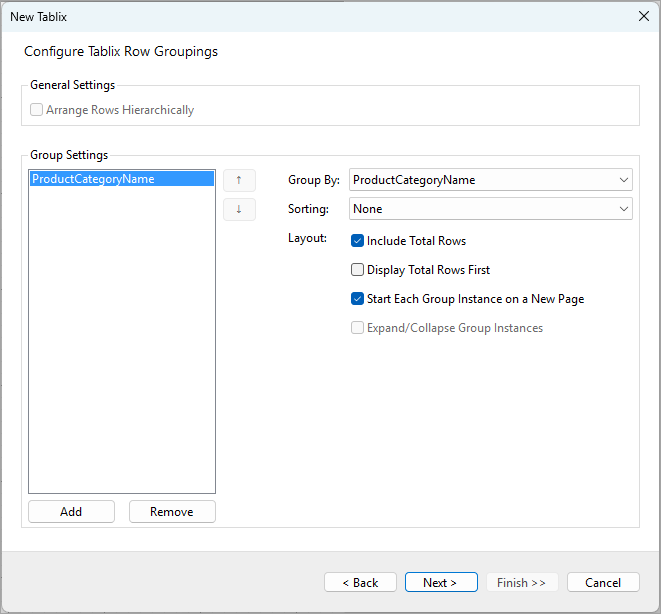
Arrange Rows Hierarchically: If this option is checked, rows will be arranged in a hierarchical structure. This option is only applicable when there are multiple row groupings.
Row Group Settings
- Group By: Choose the field you want to group your rows by. In this example, the ProductCategoryName field has been selected for grouping.
- Sorting: Select a field and sort order to define how the grouped rows should be sorted.
- Layout:
- Include Total Rows: This option is checked by default. It includes a total row for each group, summarizing the data within that group.
- Display Total Rows First: If checked, the total row will appear at the top of each group rather than the bottom.
- Start Each Group Instance on a New Page: This option, when checked, ensures that each group starts on a new page in the report.
- Expand/Collapse Group Instances: Enabling this option adds expand/collapse functionality to the group instances, making the report more interactive. This option is only applicable when there are multiple row groupings.
You can add more groups by clicking the Add button, or remove existing groups by selecting them and clicking Remove. You can also adjust the order of the groups using the up and down arrows to the right of the group list.
Click Next > to proceed to the next configuration step.
Configuring Tablix Column Groupings
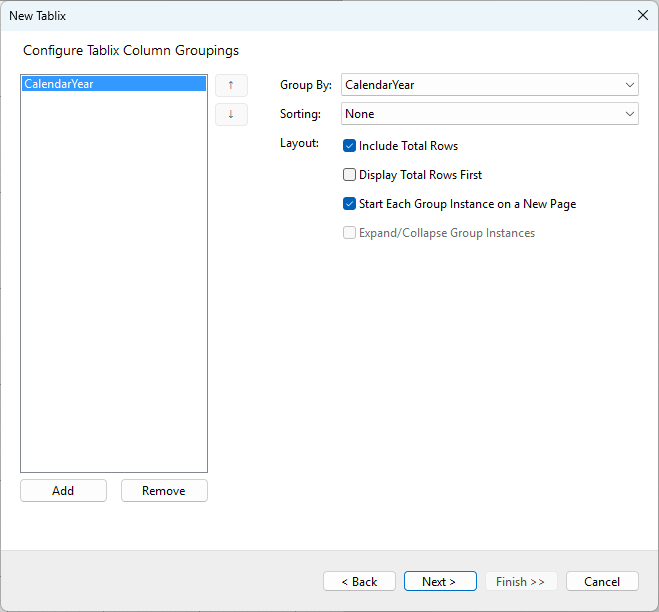
The Configure Tablix Column Groupings step allows you to configure the column groupings for your Tablix. The settings in this dialog allow you to control how columns are grouped and displayed.
Column Group Settings
- Group By: Select the field by which you want to group the columns. In this example, the CalendarYear field has been selected for grouping.
- Sorting: Define how the grouped columns should be sorted. No sorting has been applied in this example.
- Layout:
- Include Total Rows: This option is checked by default. It includes a total row for each group, summarizing the data across the grouped columns.
- Display Total Rows First: If checked, the total row will be displayed before the data rows within each group.
- Start Each Group Instance on a New Page: When this option is checked, each group starts on a new page, ensuring that data is separated visually in the report.
- Expand/Collapse Group Instances: This option allows users to expand or collapse the grouped column instances, making the report more interactive. This option is only applicable when there are multiple column groupings.
You can add more column groups by clicking the Add button, or remove existing groups by selecting them and clicking Remove. You can also adjust the order of the groups using the up and down arrows to the right of the group list.
Click Next > to proceed to the next step.