
- Spread for WPF Overview
- Key Features
- Getting Started
- Quick Start
- Designer
- Features
- Assembly Reference
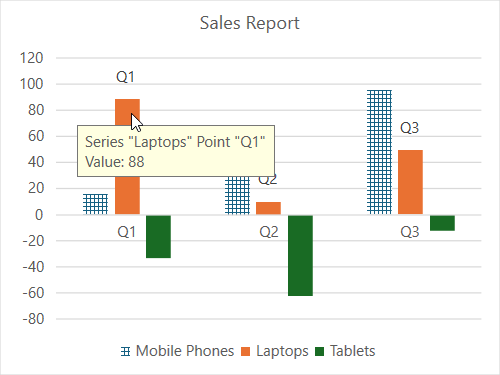
Data Series
A data series is a collection of data points that represents the data trends for a specific set of data values. A data point can have both a marker and a label.
You can plot one or more data series while creating a chart. Each series represents an item on the legend. You can get and set a series item using the ApplyDataLabels method of the ISeries interface. By applying various formatting options, you can also create visually appealing and informative charts that effectively communicate data insights.
However, if you are plotting negative values on a chart, Spread for WPF also lets you reverse the color of those negative values by setting invertIfNegative property to true. It helps in highlighting and differentiating negative values from positive values.
The following example code shows how to configure and customize the series in a chart.
C#
spreadSheet1.Workbook.ActiveSheet.Cells[0, 1].Value = "Q1";
spreadSheet1.Workbook.ActiveSheet.Cells[0, 2].Value = "Q2";
spreadSheet1.Workbook.ActiveSheet.Cells[0, 3].Value = "Q3";
spreadSheet1.Workbook.ActiveSheet.Cells[1, 0].Value = "Mobile Phones";
spreadSheet1.Workbook.ActiveSheet.Cells[2, 0].Value = "Laptops";
spreadSheet1.Workbook.ActiveSheet.Cells[3, 0].Value = "Tablets";
for (var r = 1; r <= 3; r++)
{
     for (var c = 1; c <= 3; c++)
     {
        Random random = new Random();
        spreadSheet1.Workbook.ActiveSheet.Cells[r, c].Value = 0 + random.Next(0, 100);
     }
}
spreadSheet1.Workbook.ActiveSheet.Cells["A1:D4"].Select();
spreadSheet1.Workbook.ActiveSheet.Shapes.AddChart(GrapeCity.Spreadsheet.Charts.ChartType.ColumnClustered, 100, 150, 400, 300, true);
spreadSheet1.Workbook.ActiveSheet.ChartObjects[0].Chart.ChartTitle.Text = "Sales Report";
// No data lable is visible for the series index 0.
var series1 = spreadSheet1.Workbook.ActiveSheet.ChartObjects[0].Chart.Series[0];
series1.ApplyDataLabels(DataLabelVisibilities.None);
// Show category names for the series index 1.
var series2 = spreadSheet1.Workbook.ActiveSheet.ChartObjects[0].Chart.Series[1];
series2.ApplyDataLabels(DataLabelVisibilities.CategoryName);
// Show vary colors for each data points.
spreadSheet1.Workbook.ActiveSheet.ChartObjects[0].Chart.ChartGroups[0].VaryByCategories = true;
// Set fill for data points of series.
spreadSheet1.Workbook.ActiveSheet.ChartObjects[0].Chart.Series[0].Format.Fill.Patterned(GrapeCity.Drawing.PatternType.Cross);
// Show invert color for negative values.
spreadSheet1.Workbook.ActiveSheet.ChartObjects[0].Chart.Series[0].InvertIfNegative = true;
VB
spreadSheet1.Workbook.ActiveSheet.Cells(0, 1).Value = "Q1"
spreadSheet1.Workbook.ActiveSheet.Cells(0, 2).Value = "Q2"
spreadSheet1.Workbook.ActiveSheet.Cells(0, 3).Value = "Q3"
spreadSheet1.Workbook.ActiveSheet.Cells(1, 0).Value = "Mobile Phones"
spreadSheet1.Workbook.ActiveSheet.Cells(2, 0).Value = "Laptops"
spreadSheet1.Workbook.ActiveSheet.Cells(3, 0).Value = "Tablets"
For r = 1 To 3
        For c = 1 To 3
            Dim random As Random = New Random()
            spreadSheet1.Workbook.ActiveSheet.Cells(r, c).Value = 0 + random.Next(0, 100)
        Next
Next
spreadSheet1.Workbook.ActiveSheet.Cells("A1:D4").[Select](/spreadnet/docs/latest/online-wpf/spreadwpffeatures/charts/chart-elements/data-series)
spreadSheet1.Workbook.ActiveSheet.Shapes.AddChart(GrapeCity.Spreadsheet.Charts.ChartType.ColumnClustered, 100, 150, 400, 300, True)
spreadSheet1.Workbook.ActiveSheet.ChartObjects(0).Chart.ChartTitle.Text = "Sales Report"
' No data lable is visible for the series index 0.
Dim series1 = spreadSheet1.Workbook.ActiveSheet.ChartObjects(0).Chart.Series(0)
series1.ApplyDataLabels(DataLabelVisibilities.None)
' Show category names for the series index 1.
Dim series2 = spreadSheet1.Workbook.ActiveSheet.ChartObjects(0).Chart.Series(1)
series2.ApplyDataLabels(DataLabelVisibilities.CategoryName)
' Show vary colors for each data points.
spreadSheet1.Workbook.ActiveSheet.ChartObjects(0).Chart.ChartGroups(0).VaryByCategories = True
' Set fill for data points of series.
spreadSheet1.Workbook.ActiveSheet.ChartObjects(0).Chart.Series(0).Format.Fill.Patterned(GrapeCity.Drawing.PatternType.Cross)
' Show invert color for negative values.
spreadSheet1.Workbook.ActiveSheet.ChartObjects(0).Chart.Series(0).InvertIfNegative = True