
- Spread for WPF Overview
- Key Features
- Getting Started
- Quick Start
- Designer
- Features
- Assembly Reference
Plot Area
Plot area is the area of chart where data points are plotted. If a chart has X and Y axis, plot area refers to the area covered by the axes. In a chart like pie chart or sunburst chart, plot area refers to the circular area covered by the chart itself. Use PlotArea property of the IChart interface to configure and customize the chart area.
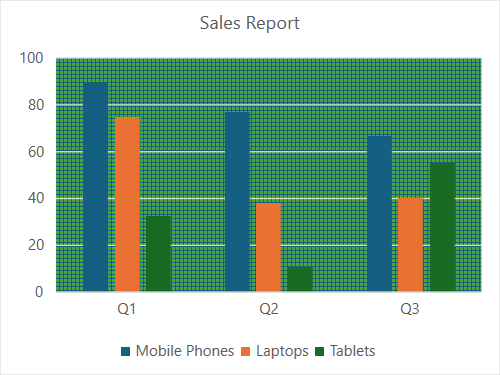
The following example code configures the plot area, setting its position to automatic and applying a patterned fill.
C#
spreadSheet1.Workbook.ActiveSheet.Cells[0, 1].Value = "Q1";
spreadSheet1.Workbook.ActiveSheet.Cells[0, 2].Value = "Q2";
spreadSheet1.Workbook.ActiveSheet.Cells[0, 3].Value = "Q3";
spreadSheet1.Workbook.ActiveSheet.Cells[1, 0].Value = "Mobile Phones";
spreadSheet1.Workbook.ActiveSheet.Cells[2, 0].Value = "Laptops";
spreadSheet1.Workbook.ActiveSheet.Cells[3, 0].Value = "Tablets";
for (var r = 1; r <= 3; r++)
{
     for (var c = 1; c <= 3; c++)
     {
        Random random = new Random();
        spreadSheet1.Workbook.ActiveSheet.Cells[r, c].Value = 0 + random.Next(0, 100);
     }
}
spreadSheet1.Workbook.ActiveSheet.Cells["A1:D4"].Select();
spreadSheet1.Workbook.ActiveSheet.Shapes.AddChart(GrapeCity.Spreadsheet.Charts.ChartType.ColumnClustered, 100, 150, 400, 300, true);
spreadSheet1.Workbook.ActiveSheet.ChartObjects[0].Chart.ChartTitle.Text = "Sales Report";
var plotArea = spreadSheet1.Workbook.ActiveSheet.ChartObjects[0].Chart.PlotArea;
plotArea.Position = ChartElementPosition.Automatic;
plotArea.Format.Fill.Patterned(GrapeCity.Drawing.PatternType.Cross);
plotArea.Format.Fill.BackColor.ObjectThemeColor = GrapeCity.Core.SchemeThemeColors.Accent6;
VB
spreadSheet1.Workbook.ActiveSheet.Cells(0, 1).Value = "Q1"
spreadSheet1.Workbook.ActiveSheet.Cells(0, 2).Value = "Q2"
spreadSheet1.Workbook.ActiveSheet.Cells(0, 3).Value = "Q3"
spreadSheet1.Workbook.ActiveSheet.Cells(1, 0).Value = "Mobile Phones"
spreadSheet1.Workbook.ActiveSheet.Cells(2, 0).Value = "Laptops"
spreadSheet1.Workbook.ActiveSheet.Cells(3, 0).Value = "Tablets"
For r = 1 To 3
        For c = 1 To 3
            Dim random As Random = New Random()
            spreadSheet1.Workbook.ActiveSheet.Cells(r, c).Value = 0 + random.Next(0, 100)
        Next
Next
spreadSheet1.Workbook.ActiveSheet.Cells("A1:D4").[Select](/spreadnet/docs/latest/online-wpf/spreadwpffeatures/charts/chart-elements/plot-area)
spreadSheet1.Workbook.ActiveSheet.Shapes.AddChart(GrapeCity.Spreadsheet.Charts.ChartType.ColumnClustered, 100, 150, 400, 300, True)
spreadSheet1.Workbook.ActiveSheet.ChartObjects(0).Chart.ChartTitle.Text = "Sales Report"
Dim plotArea = spreadSheet1.Workbook.ActiveSheet.ChartObjects(0).Chart.PlotArea
plotArea.Position = ChartElementPosition.Automatic
plotArea.Format.Fill.Patterned(GrapeCity.Drawing.PatternType.Cross)
plotArea.Format.Fill.BackColor.ObjectThemeColor = GrapeCity.Core.SchemeThemeColors.Accent6