
- Spread for WPF Overview
- Key Features
- Getting Started
- Quick Start
- Designer
- Features
- Assembly Reference
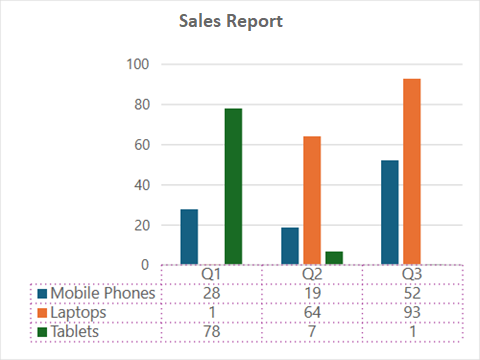
Data Table
A chart data table refers to a grid that displays the source data of the chart and is positioned under the chart. The data table, along with the chart, provides an organized way to read exact values, especially when data labels are difficult to interpret or are not set.
To display a data table below a chart, use the ShowDataTable method of the IChart interface. Once the data table is added, you can configure it using various properties and methods of the IDataTable interface. This interface includes properties like HasBorderHorizontal, HasBorderVertical, and HasBorderOutline to control the display of cell borders and the table outline. You can also customize the font style, fill and line style of the data table using the Font and Format properties.
Refer to the following example code to add and configure a chart data table.
C#
// Add data.
spreadSheet1.Workbook.ActiveSheet.Cells[0, 0].Value = "Record";
spreadSheet1.Workbook.ActiveSheet.Cells[2, 1].Value = "Q1";
spreadSheet1.Workbook.ActiveSheet.Cells[2, 2].Value = "Q2";
spreadSheet1.Workbook.ActiveSheet.Cells[2, 3].Value = "Q3";
spreadSheet1.Workbook.ActiveSheet.Cells[3, 0].Value = "Mobile Phones";
spreadSheet1.Workbook.ActiveSheet.Cells[4, 0].Value = "Laptops";
spreadSheet1.Workbook.ActiveSheet.Cells[5, 0].Value = "Tablets";
for (var r = 3; r <= 5; r++)
{
    for (var c = 1; c <= 3; c++)
    {
        Random random = new Random();
        spreadSheet1.Workbook.ActiveSheet.Cells[r, c].Value = 0 + random.Next(0, 100);
    }
}
// Add chart.
spreadSheet1.Workbook.ActiveSheet.Cells["A3:D6"].Select();
spreadSheet1.Workbook.ActiveSheet.Shapes.AddChart(GrapeCity.Spreadsheet.Charts.ChartType.ColumnClustered, 100, 150, 400, 300, true);
// Display data table.
spreadSheet1.Workbook.ActiveSheet.ChartObjects[0].Chart.ShowDataTable();
var dt = spreadSheet1.Workbook.ActiveSheet.ChartObjects[0].Chart.DataTable;
dt.Format.Line.DashStyle = GrapeCity.Drawing.DashStyle.Dot;
dt.Font.Size = 10;
dt.Border.Color = GrapeCity.Spreadsheet.Color.FromThemeColor(GrapeCity.Core.ThemeColors.Accent5);
VB
' Add data.
spreadSheet1.Workbook.ActiveSheet.Cells(0, 0).Value = "Record"
spreadSheet1.Workbook.ActiveSheet.Cells(2, 1).Value = "Q1"
spreadSheet1.Workbook.ActiveSheet.Cells(2, 2).Value = "Q2"
spreadSheet1.Workbook.ActiveSheet.Cells(2, 3).Value = "Q3"
spreadSheet1.Workbook.ActiveSheet.Cells(3, 0).Value = "Mobile Phones"
spreadSheet1.Workbook.ActiveSheet.Cells(4, 0).Value = "Laptops"
spreadSheet1.Workbook.ActiveSheet.Cells(5, 0).Value = "Tablets"
For r = 3 To 5
    For c = 1 To 3
         Dim random As Random = New Random()
         spreadSheet1.Workbook.ActiveSheet.Cells(r, c).Value = 0 + random.Next(0, 100)
    Next
Next
' Add chart.
spreadSheet1.Workbook.ActiveSheet.Cells("A3:D6").[Select](/spreadnet/docs/latest/online-wpf/spreadwpffeatures/charts/chart-elements/data-table)
spreadSheet1.Workbook.ActiveSheet.Shapes.AddChart(GrapeCity.Spreadsheet.Charts.ChartType.ColumnClustered, 100, 150, 400, 300, True)
' Display data table.
spreadSheet1.Workbook.ActiveSheet.ChartObjects(0).Chart.ShowDataTable()
Dim dt = spreadSheet1.Workbook.ActiveSheet.ChartObjects(0).Chart.DataTable
dt.Format.Line.DashStyle = GrapeCity.Drawing.DashStyle.Dot
dt.Font.Size = 10
dt.Border.Color = GrapeCity.Spreadsheet.Color.FromThemeColor(GrapeCity.Core.ThemeColors.Accent5)